

We cultivate premium orchard produce
with a commitment to the highest
standards of environmental
responsibility
CLOSED FOR THE SEASON
join our mailing list for opening date in 2026
About Crookes
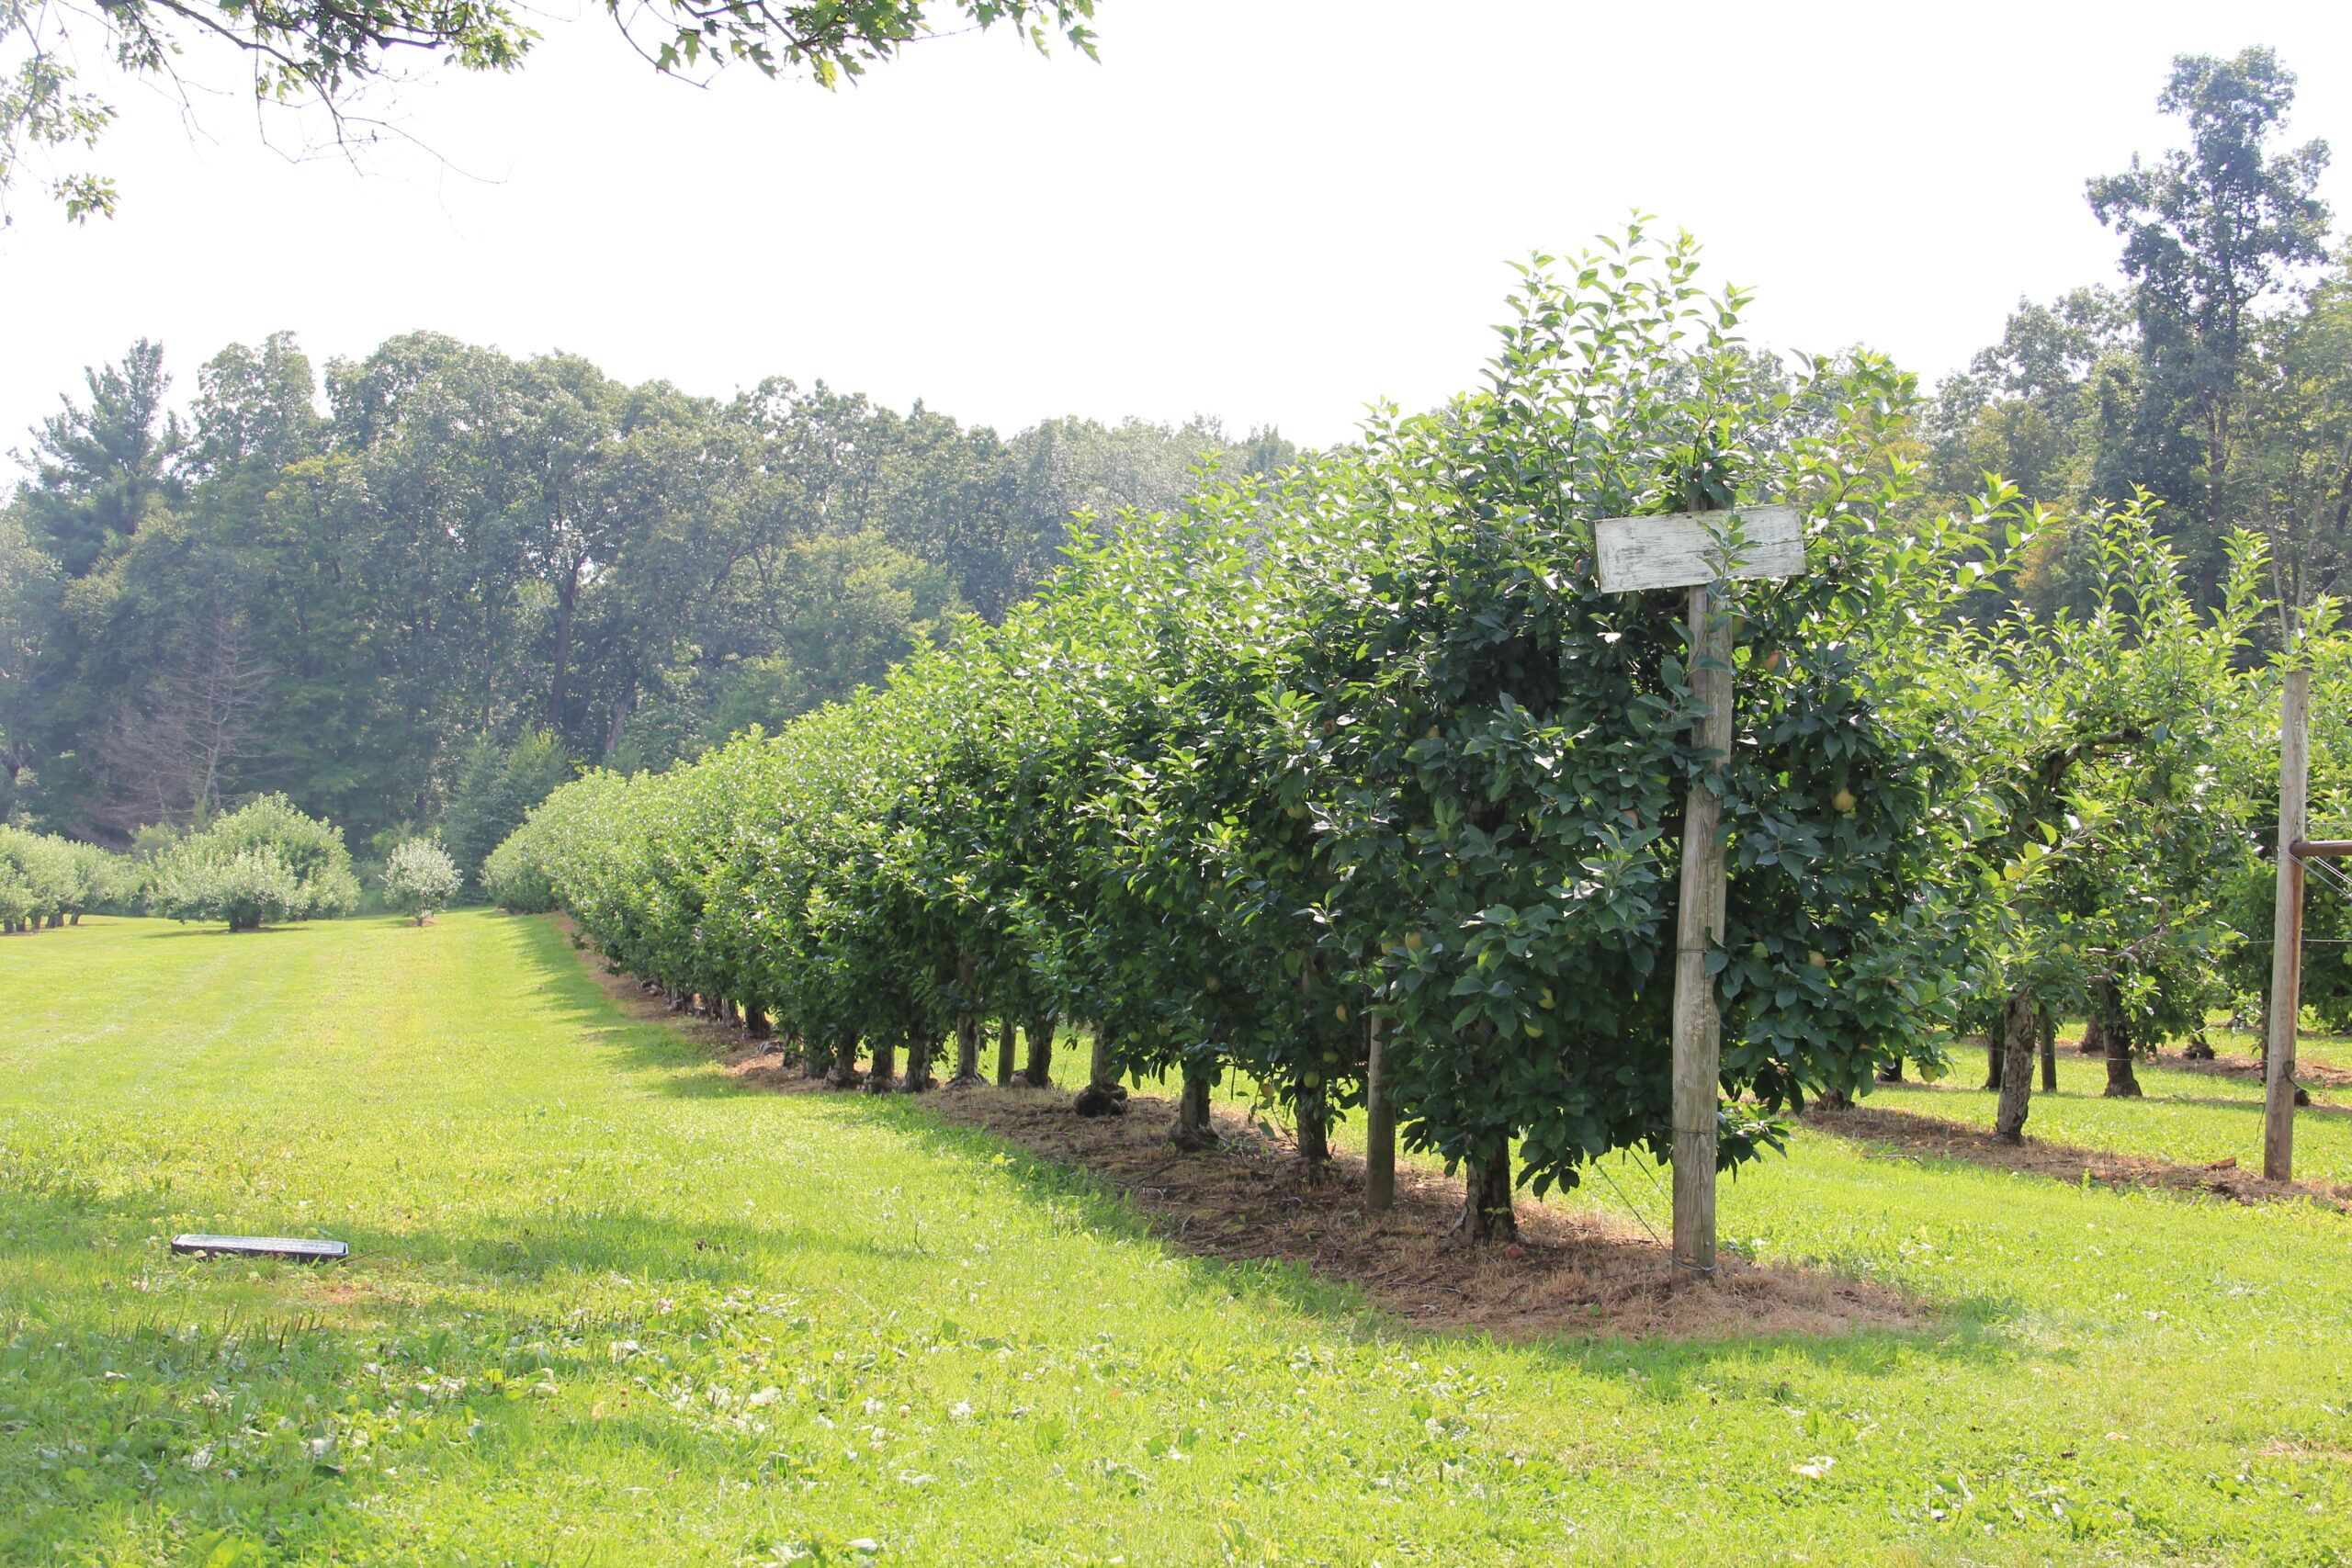
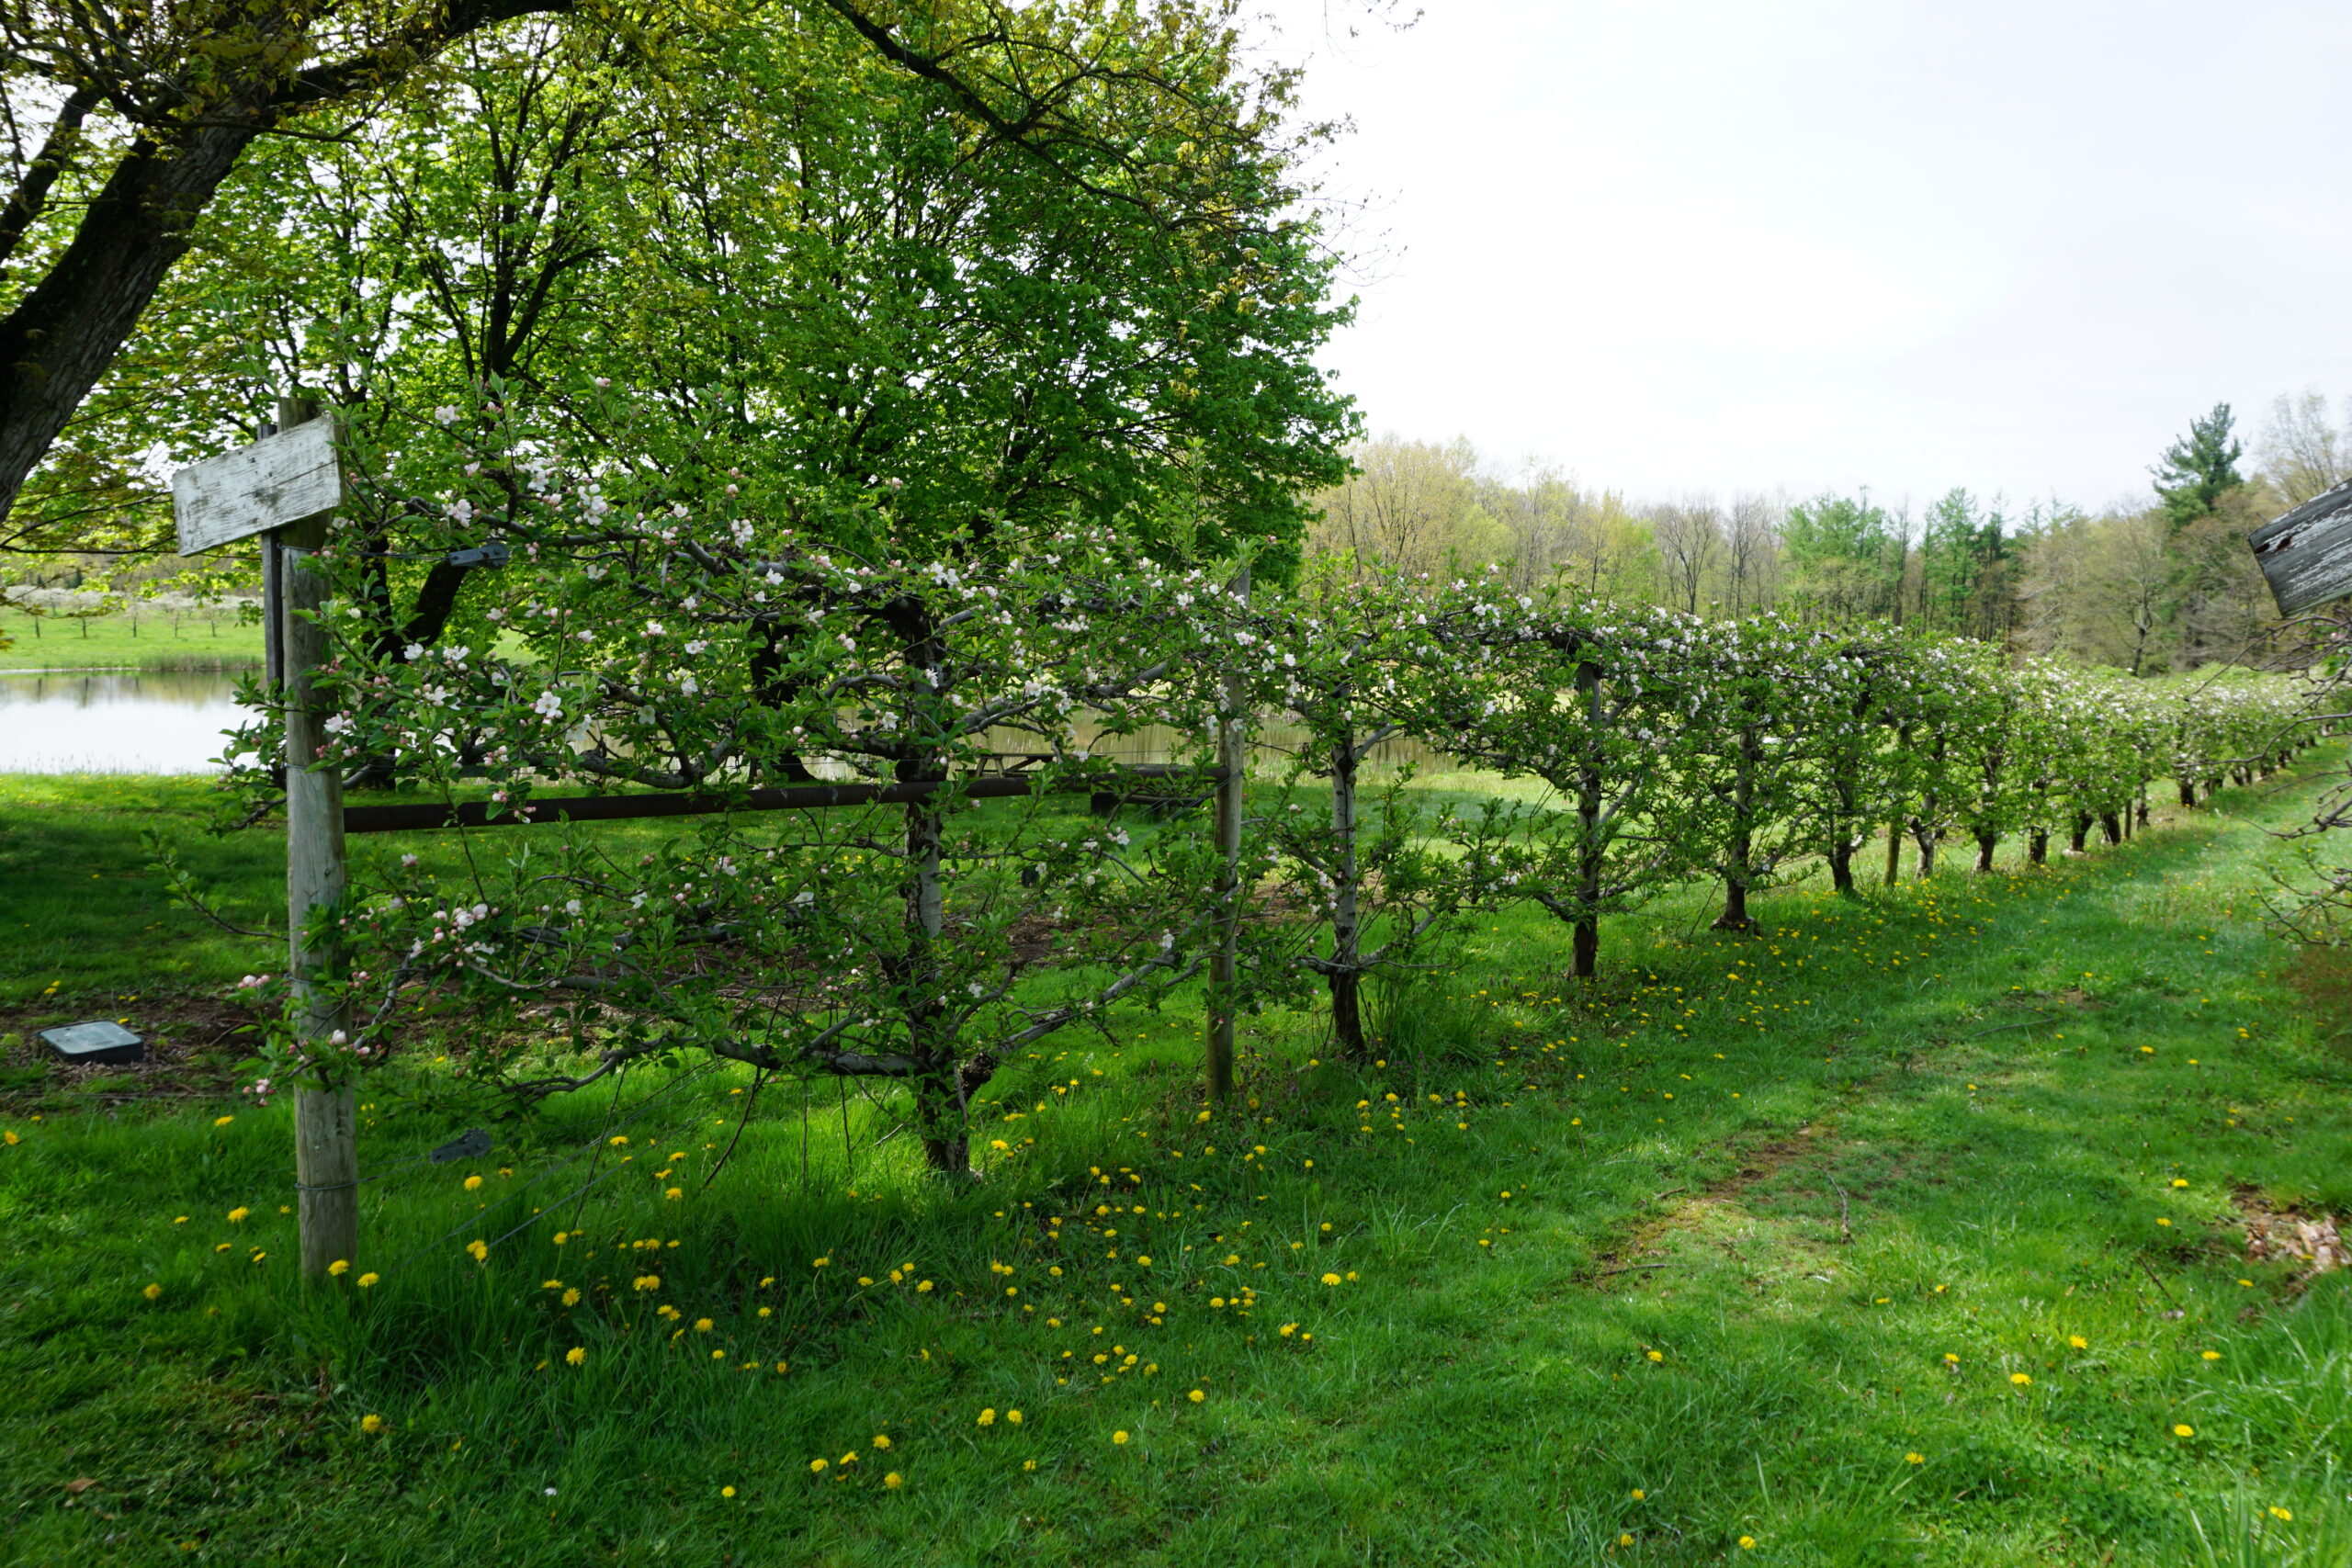
Nestled at the foothills of Windham County in Connecticut, Crookes Orchard is a source of pride and heritage.
Established in 1966 on a deserted dairy farm by the Crooke family, our orchard underwent a transition in ownership for 17 years, operating under the name Horse Listener’s Orchard. However, in homage to the original family and due to the pervasive local preference, we reverted to the name Crookes.
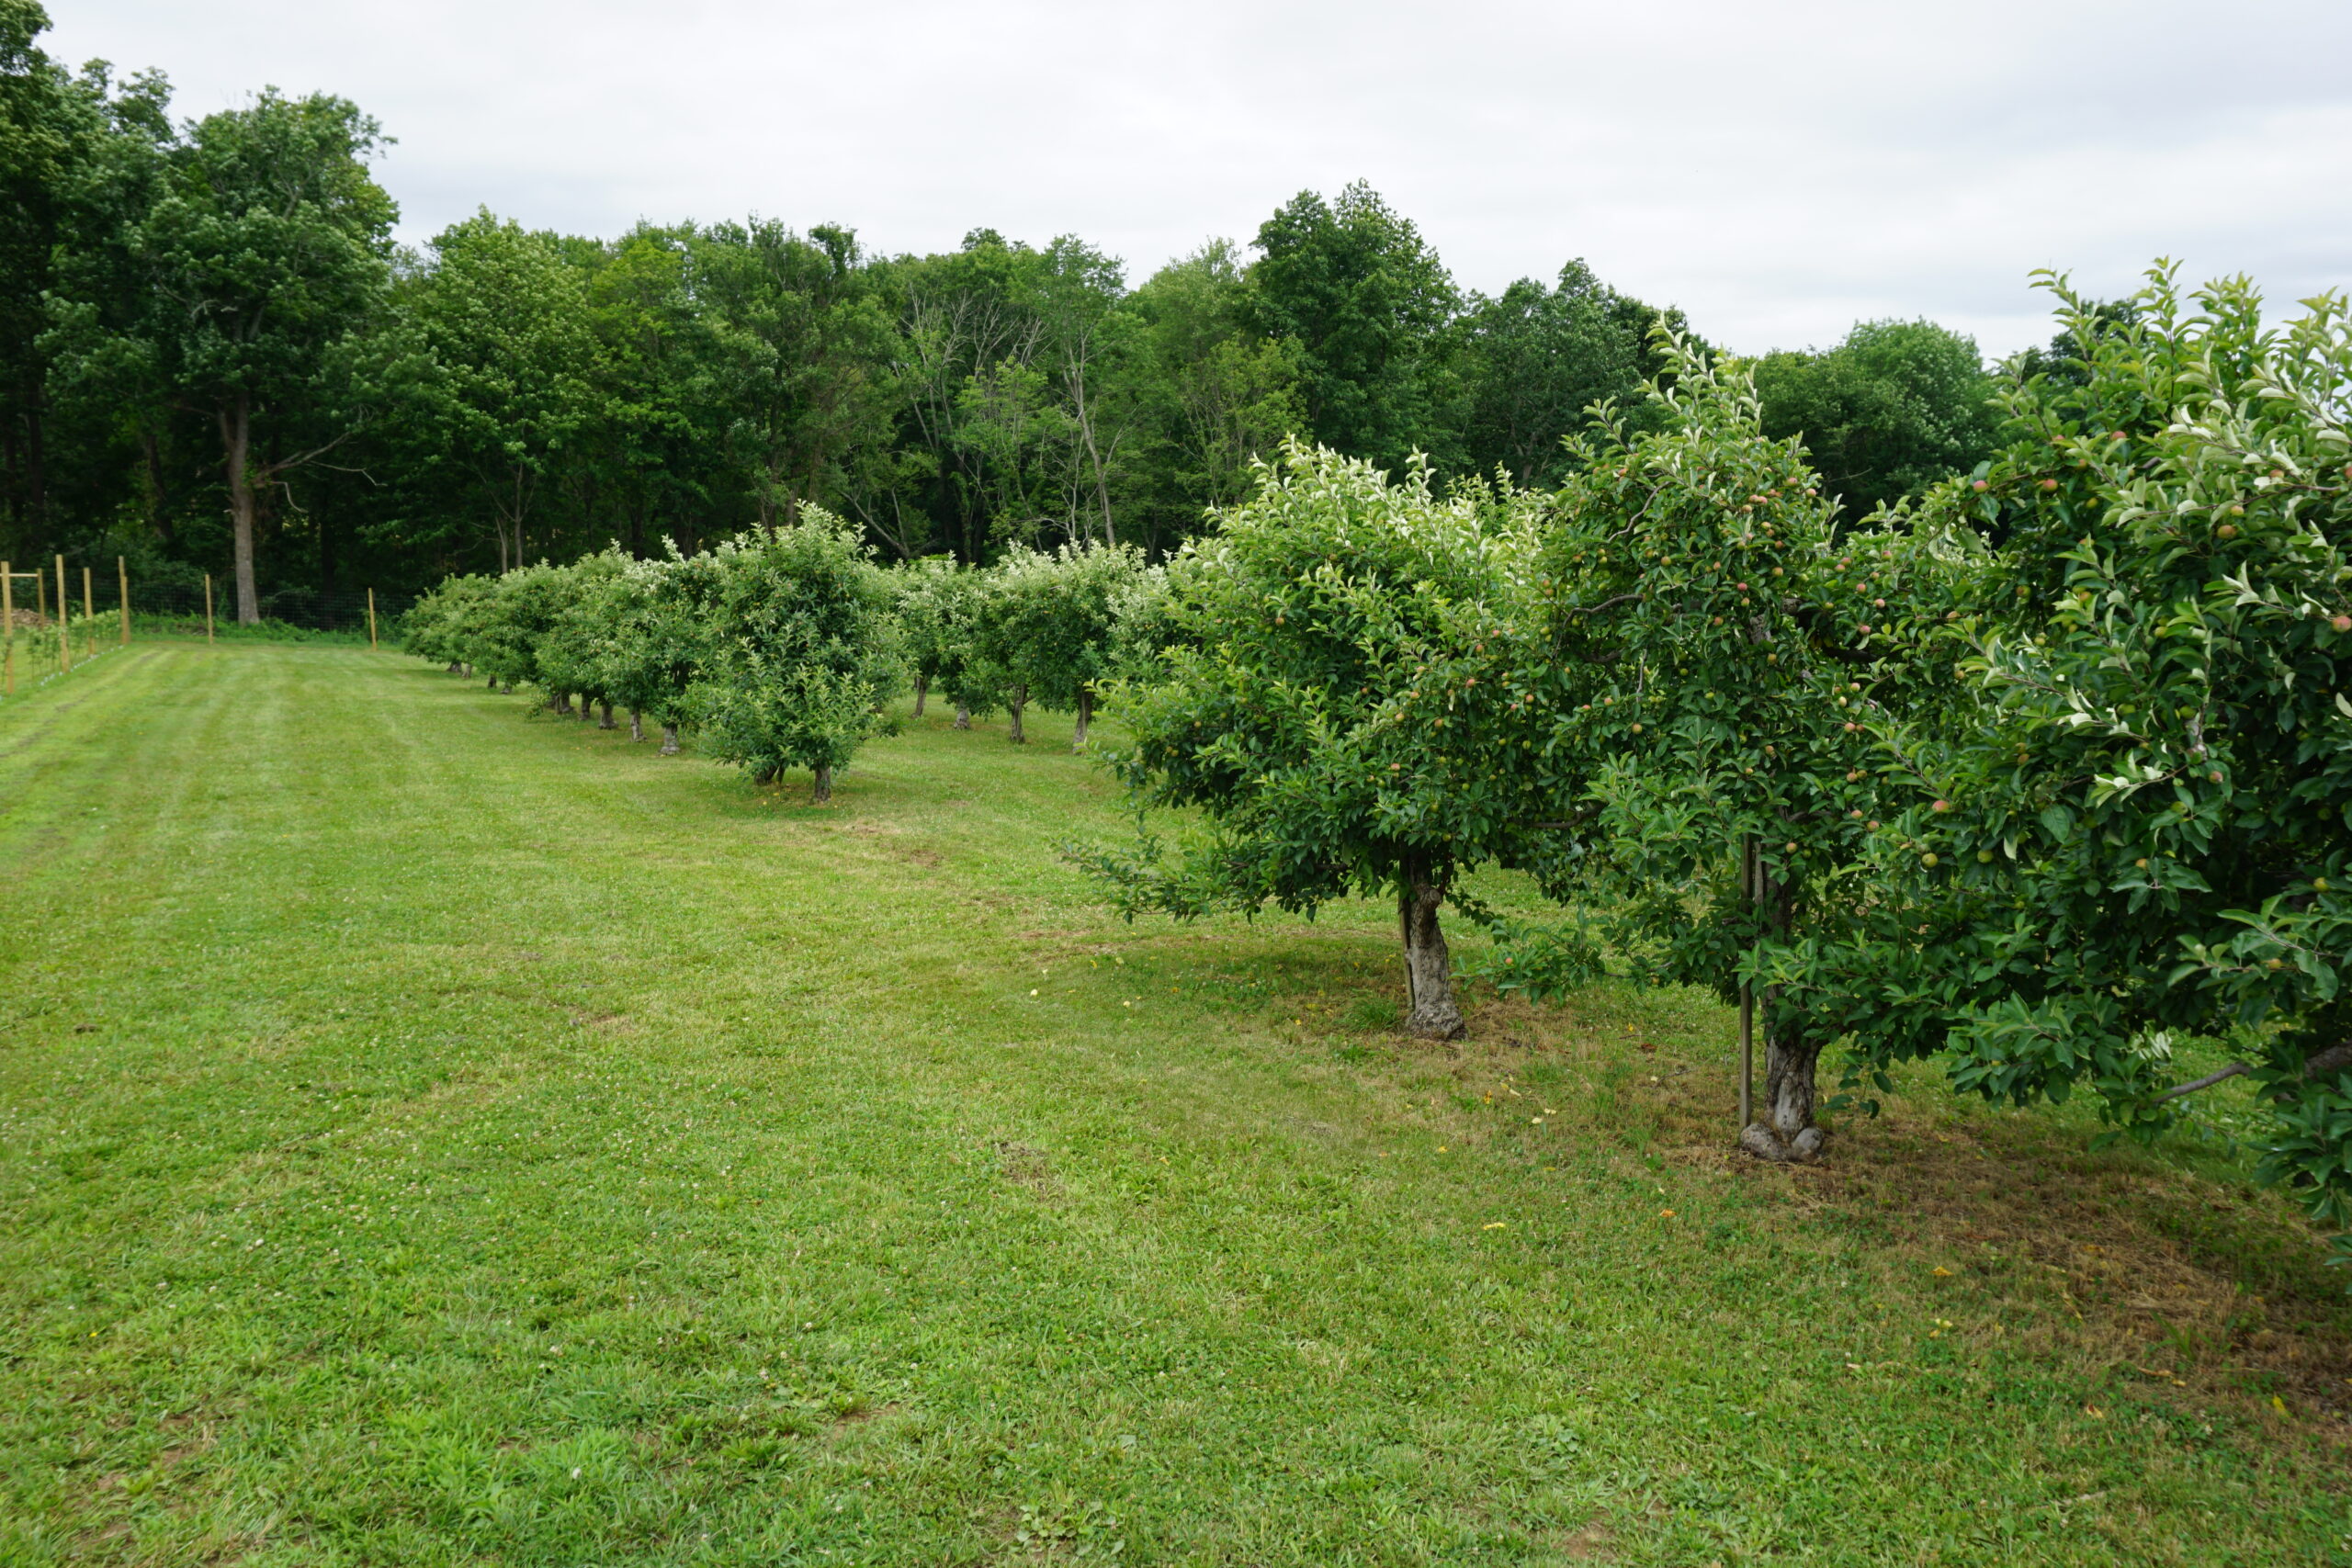
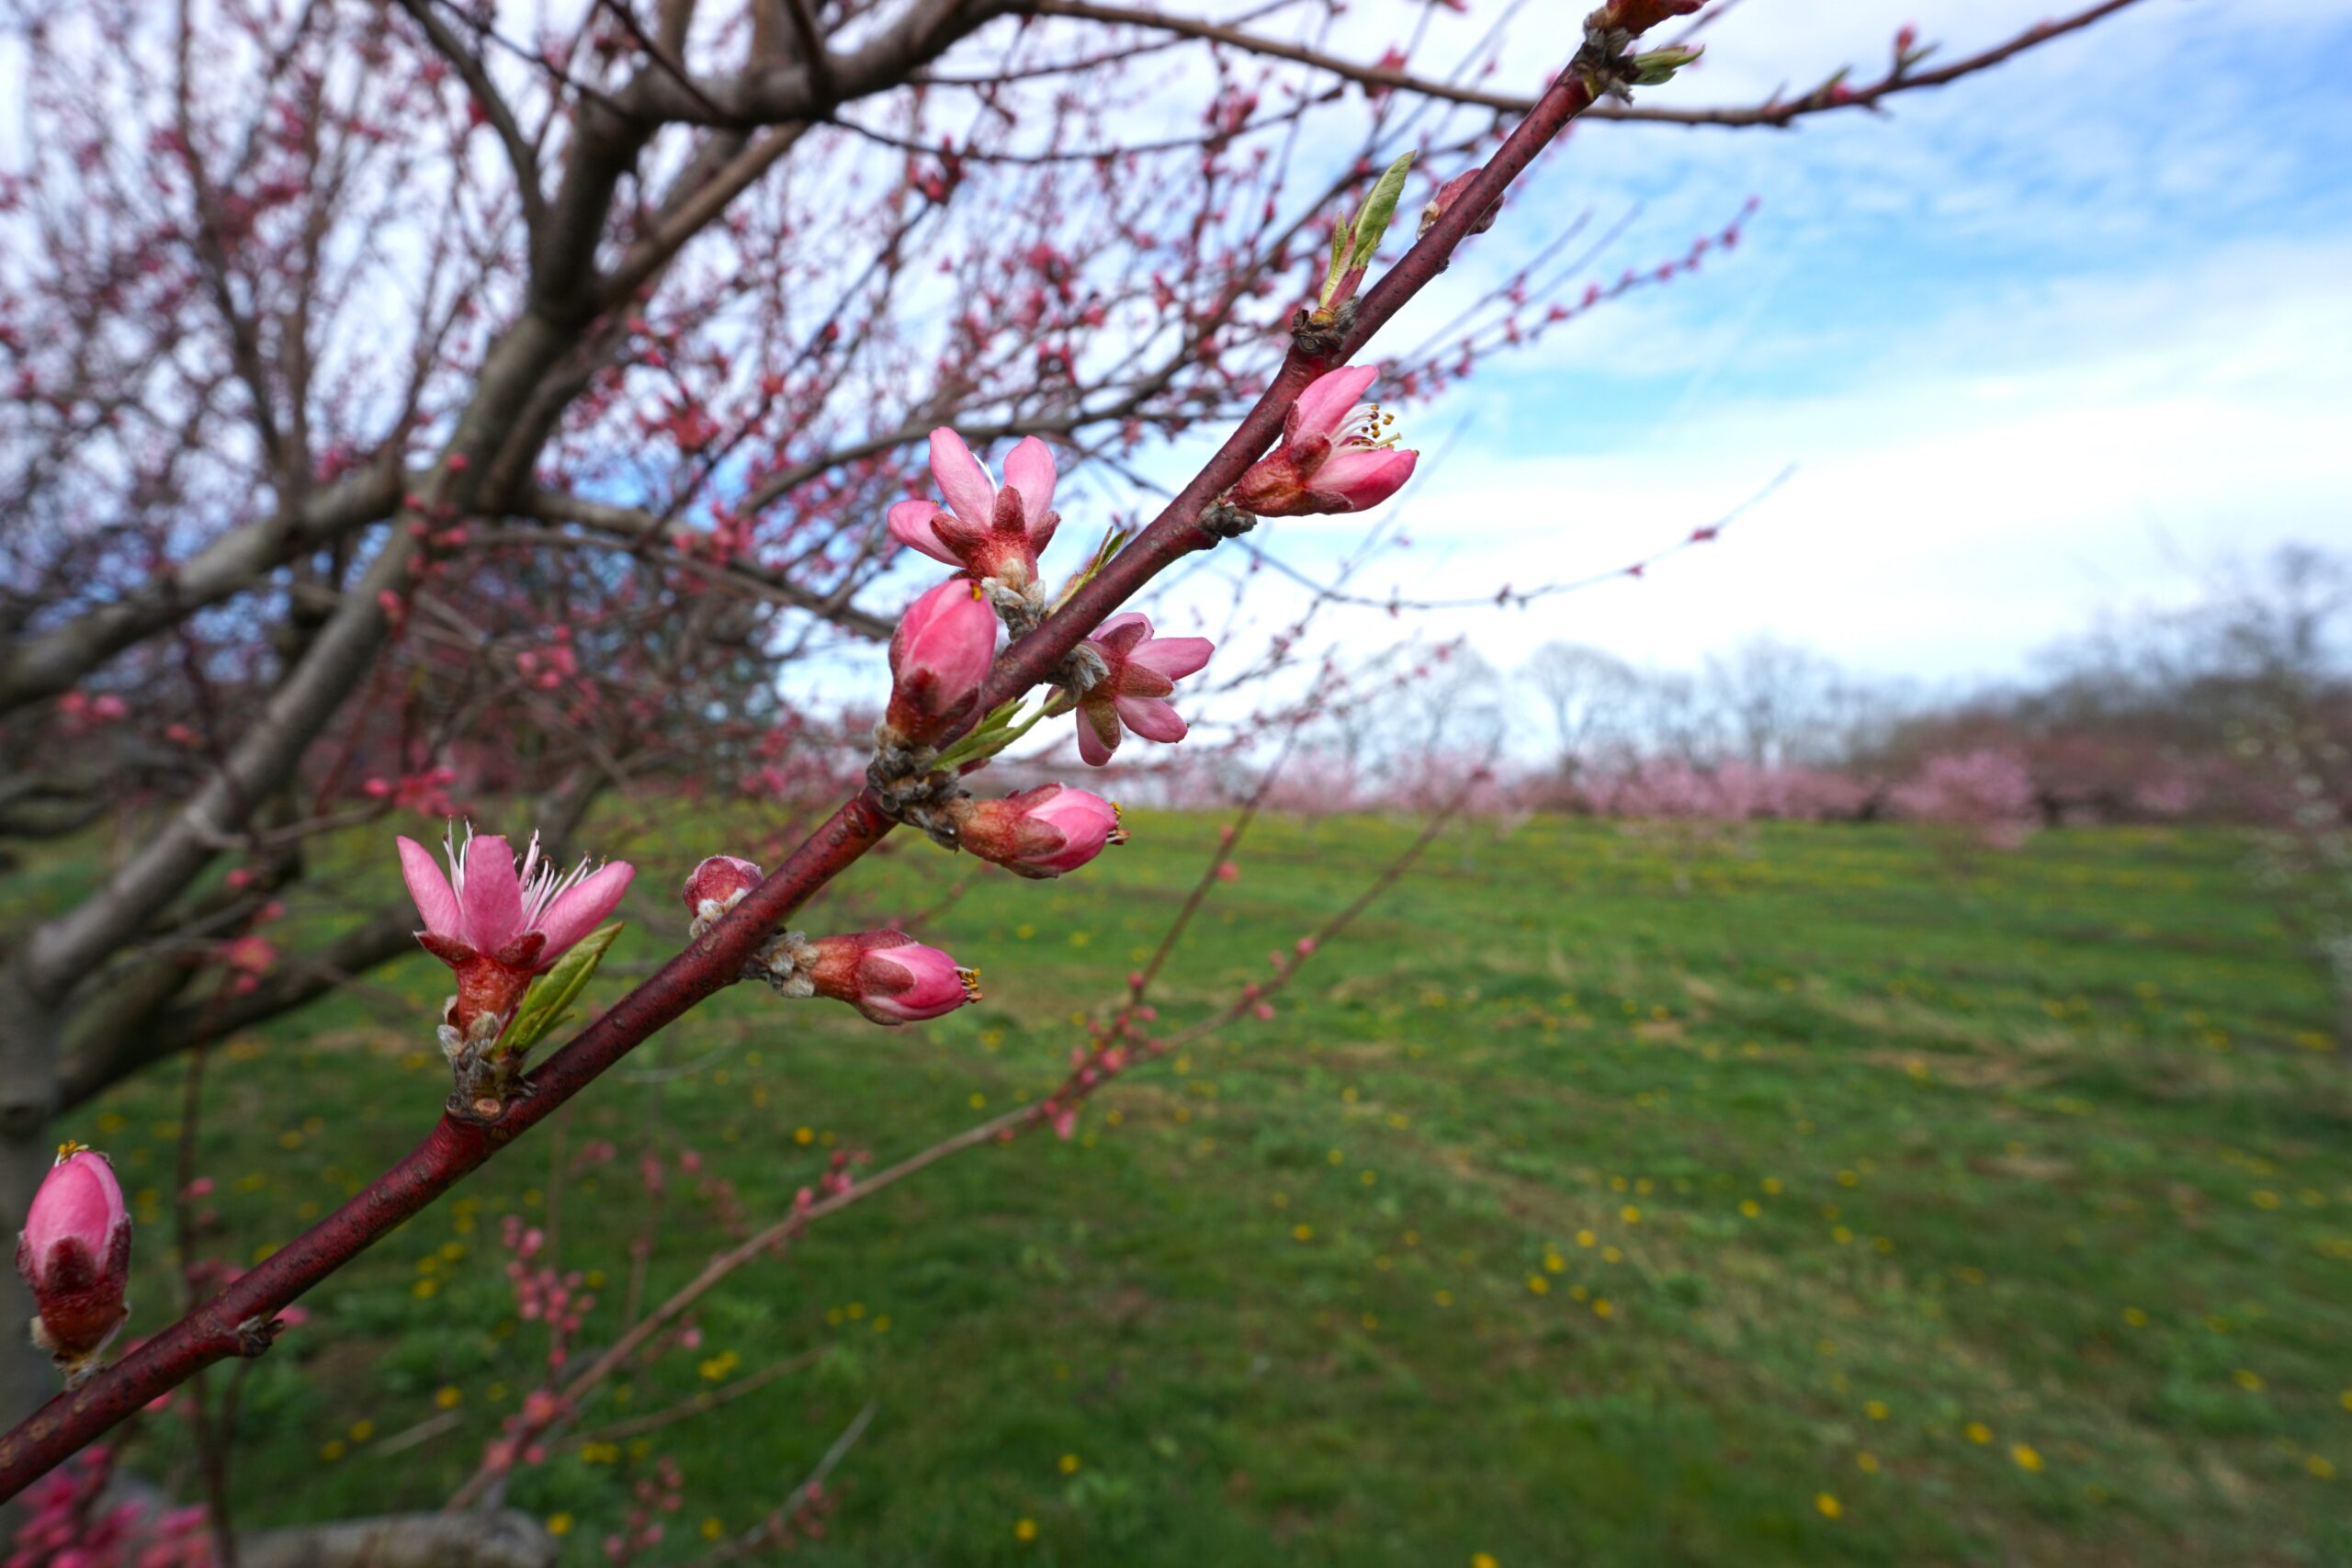
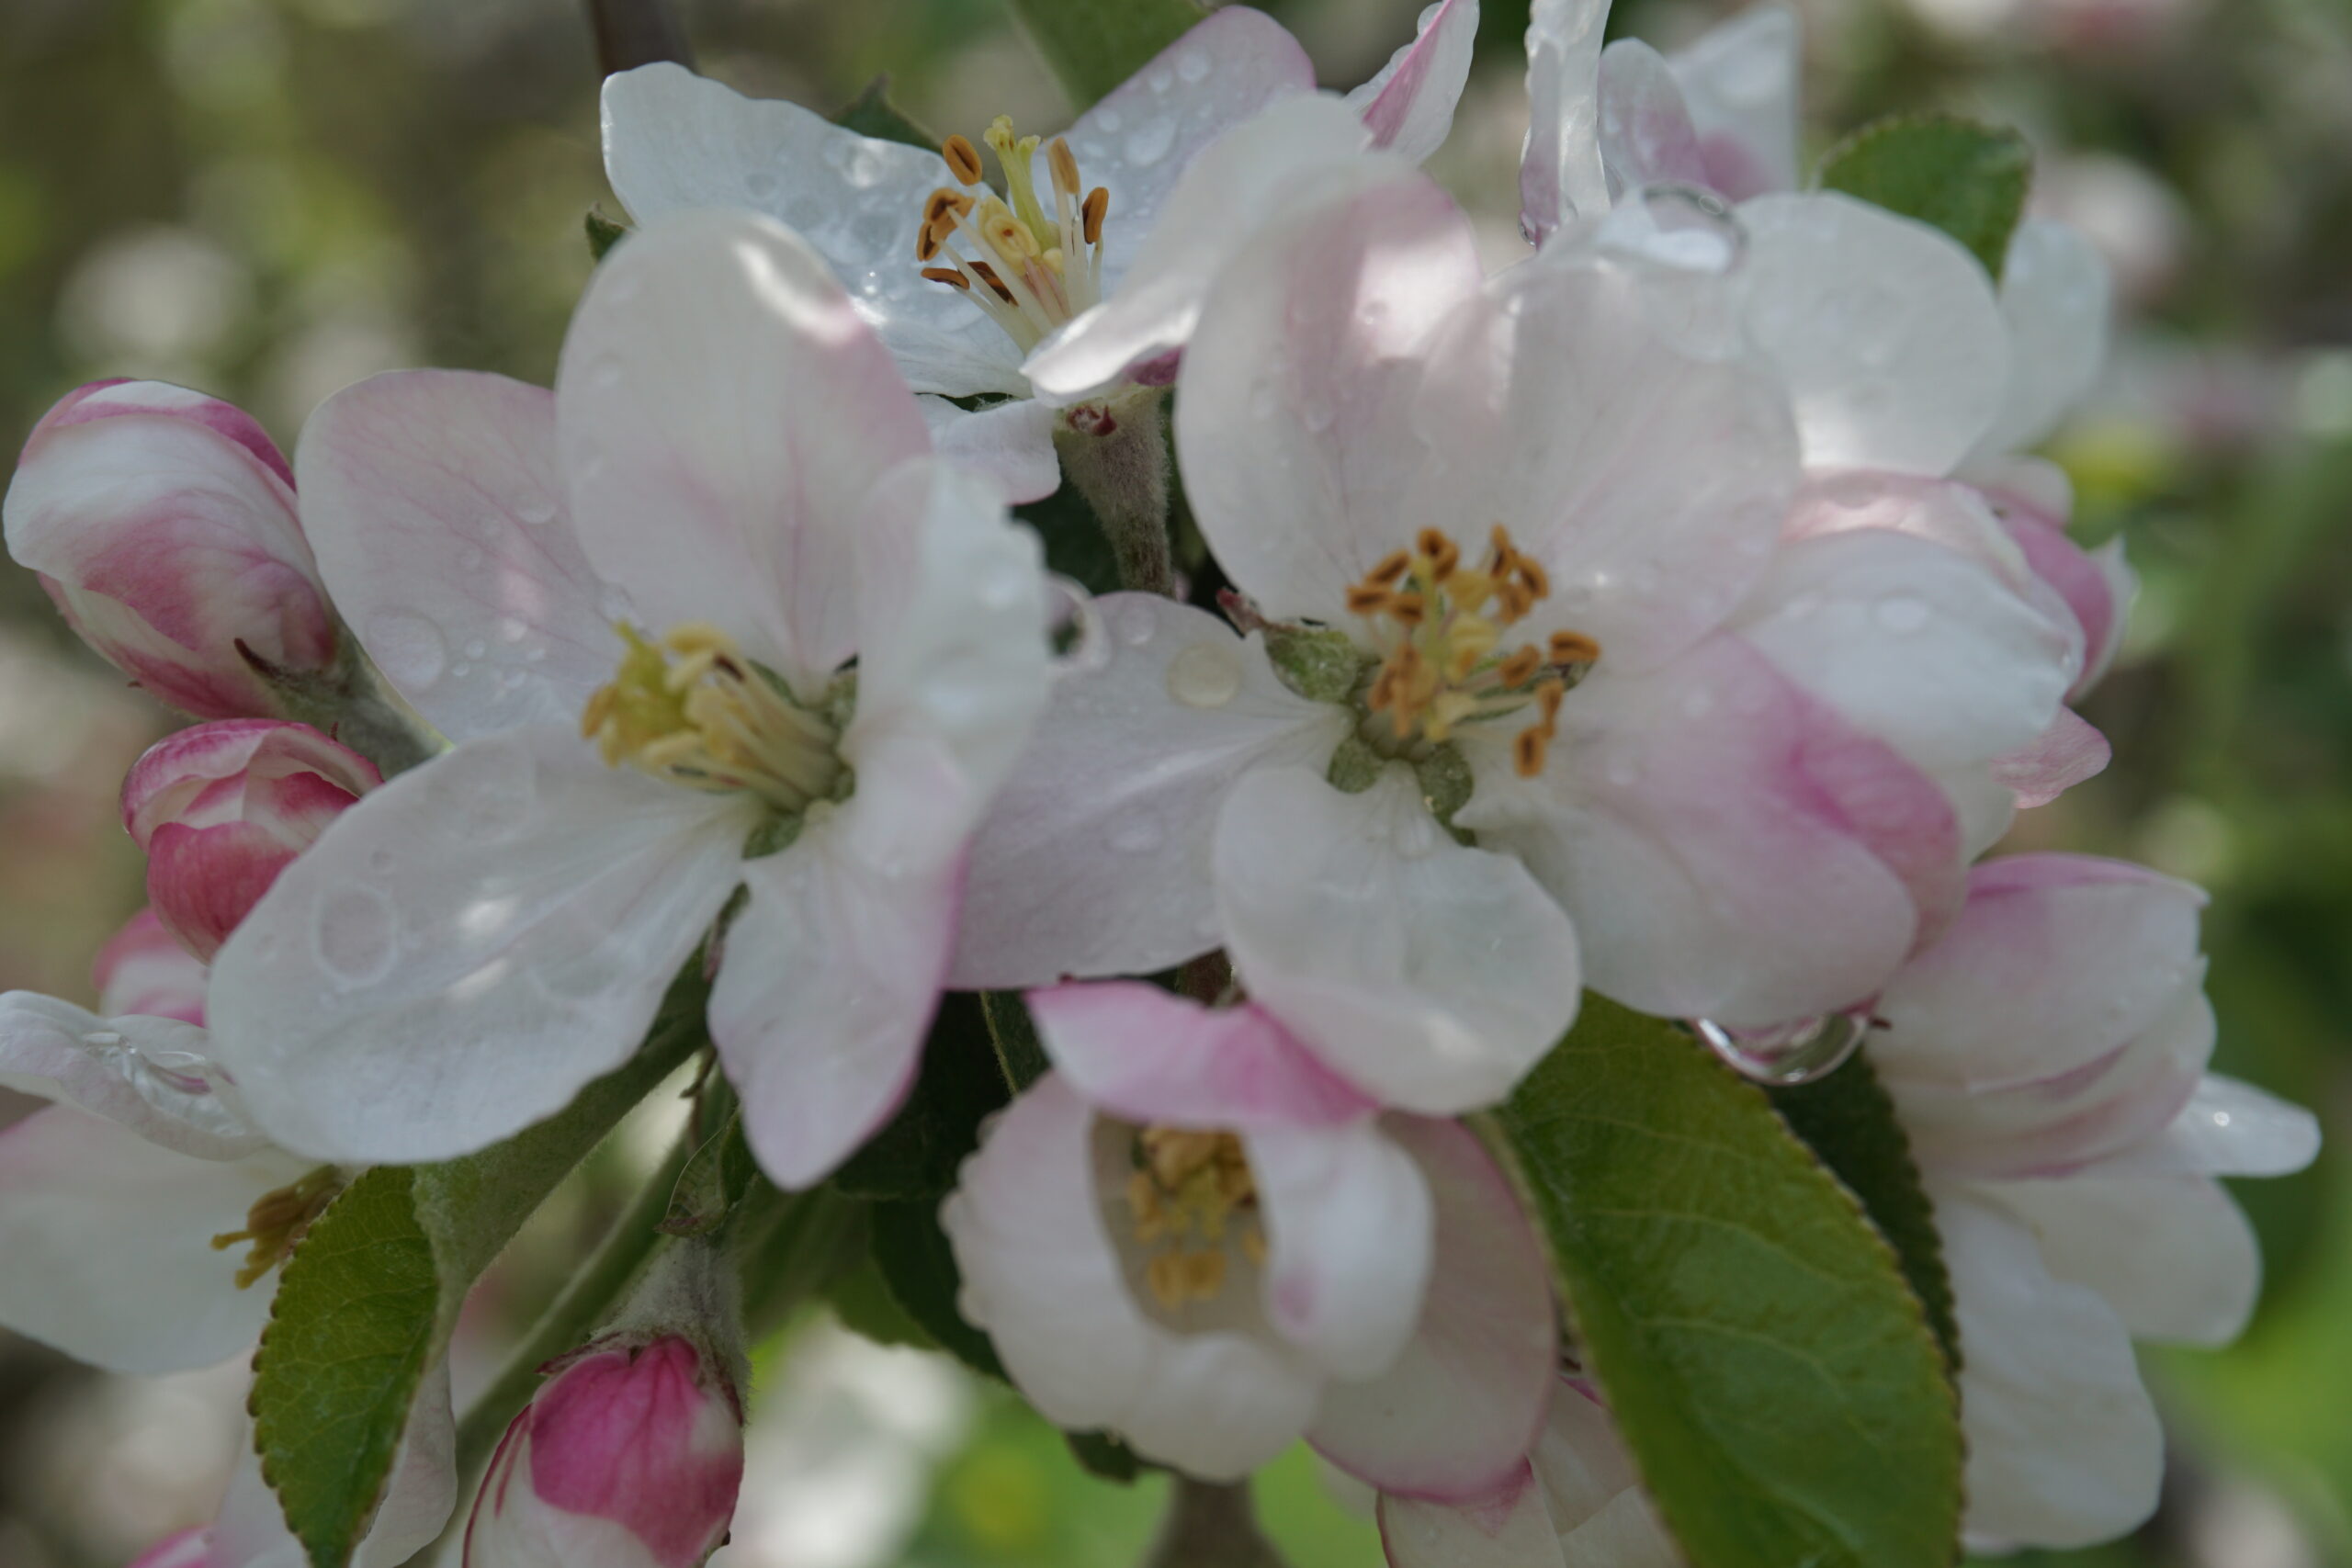
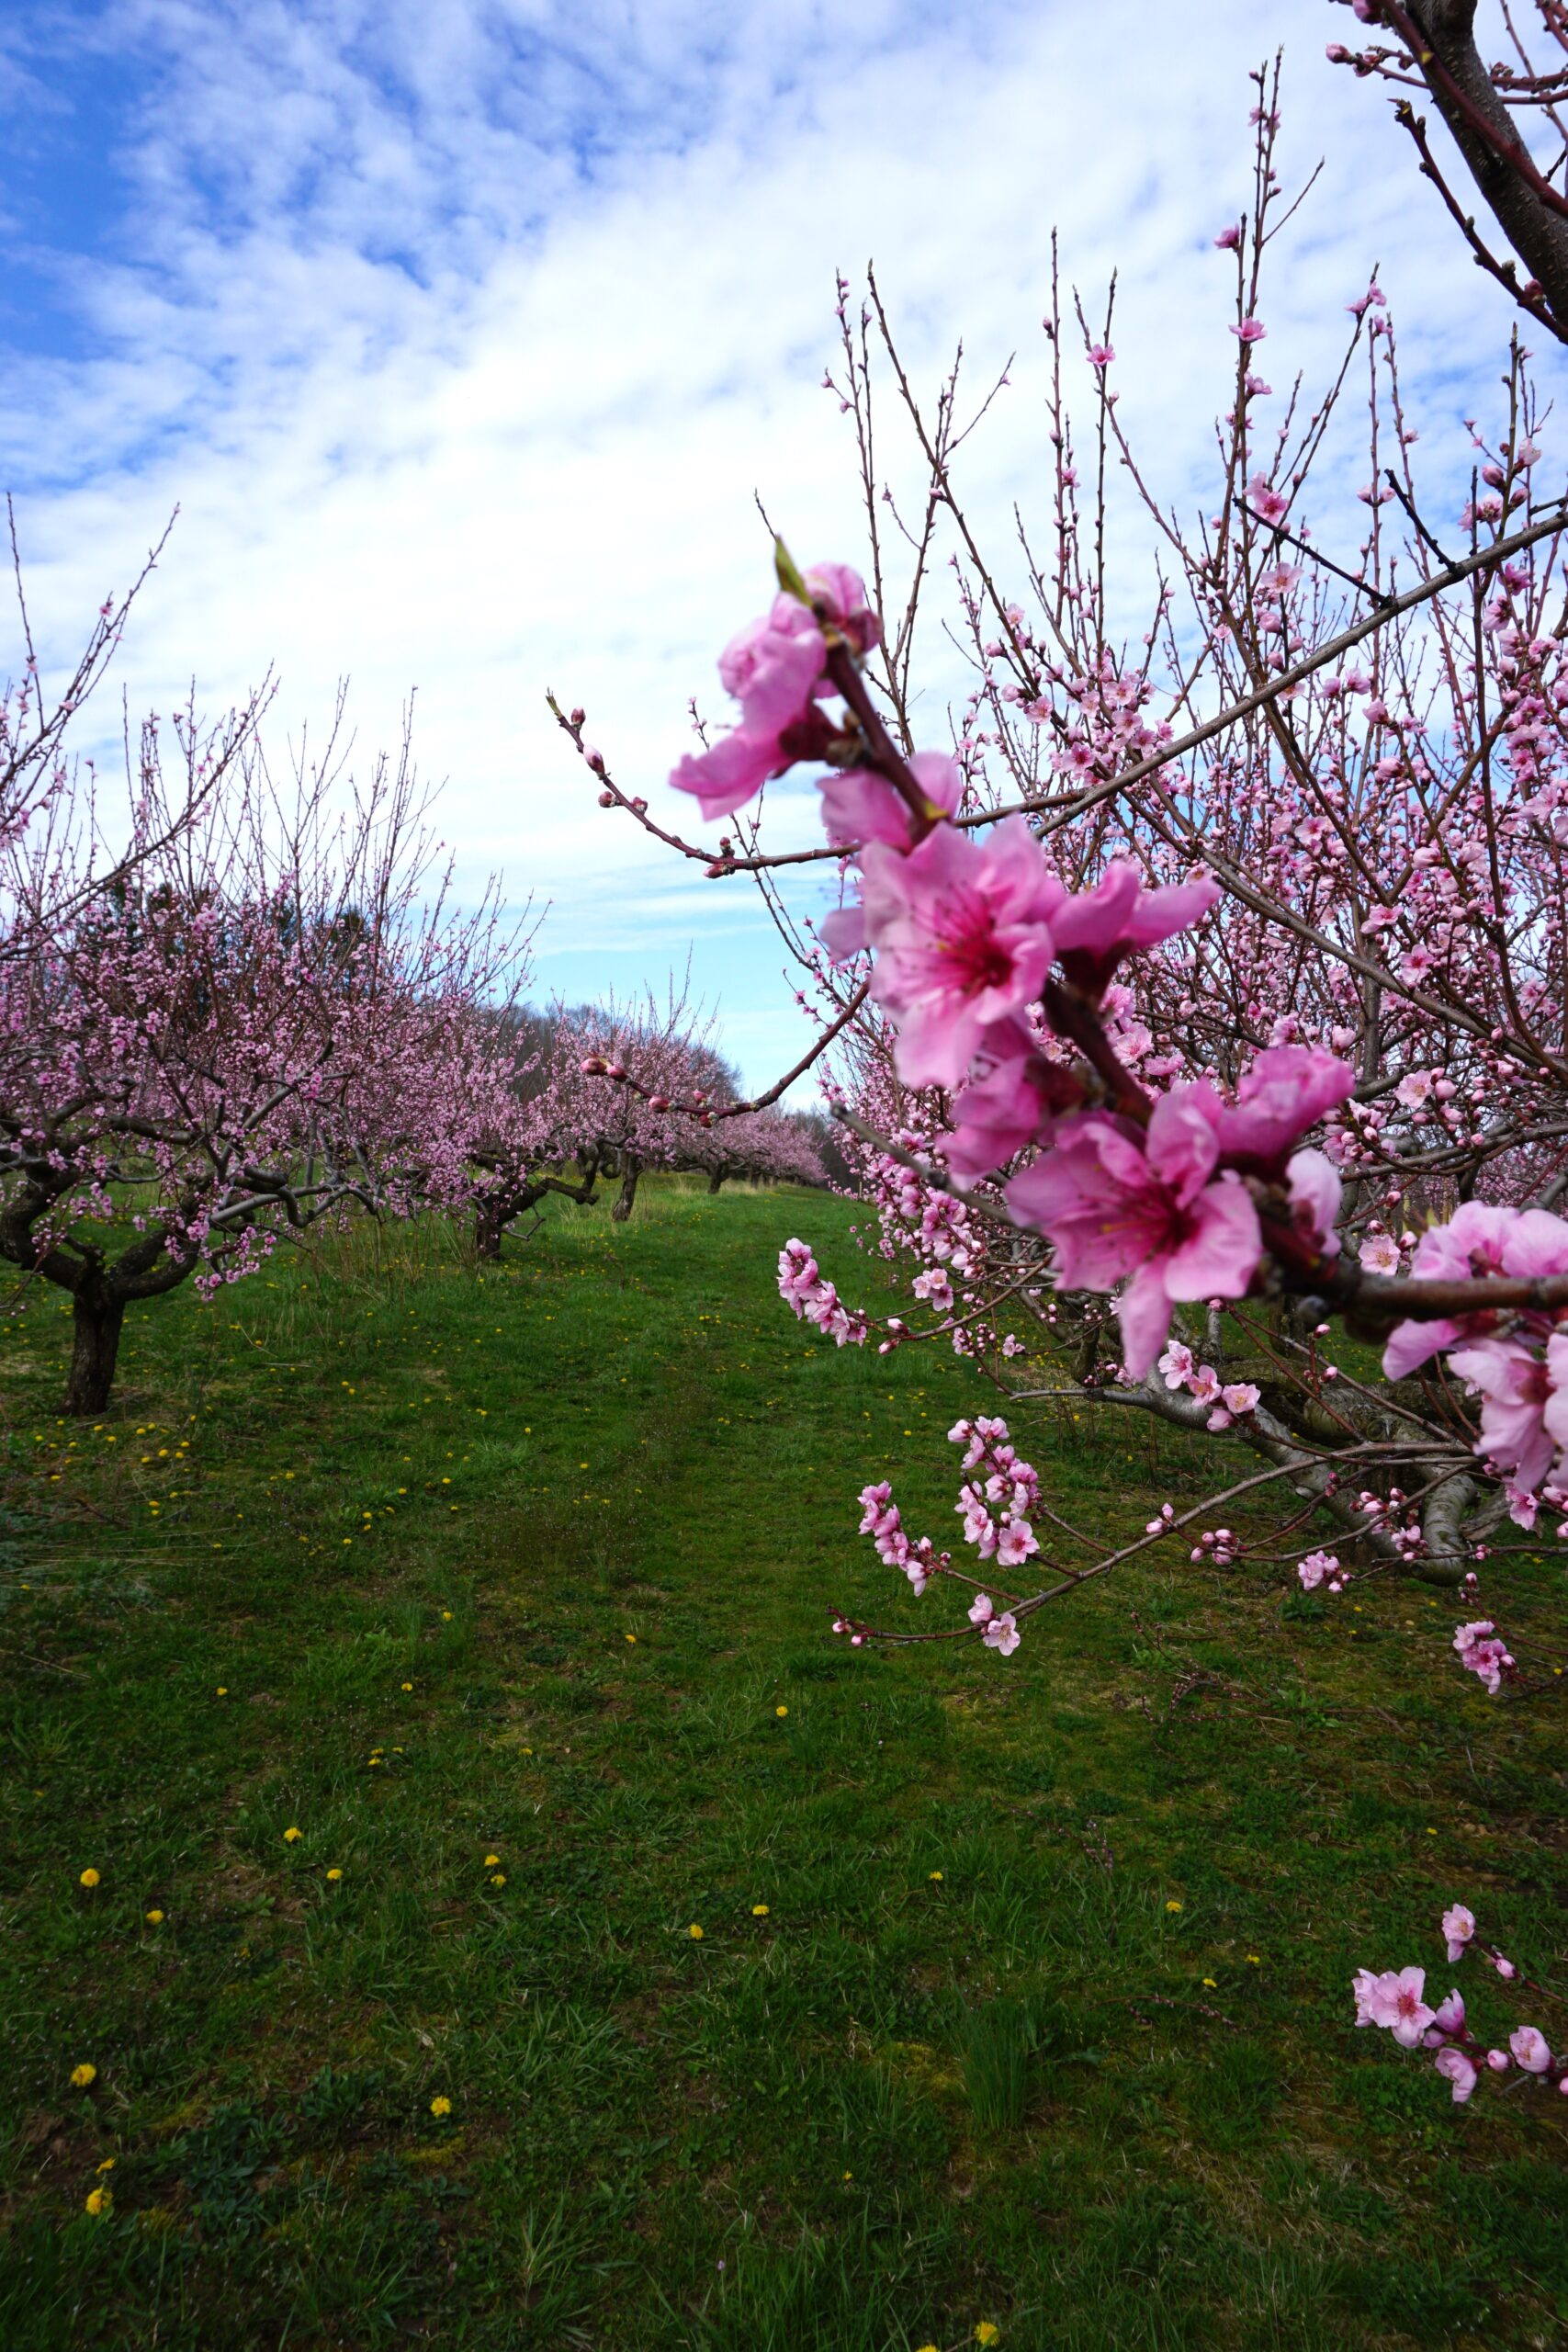
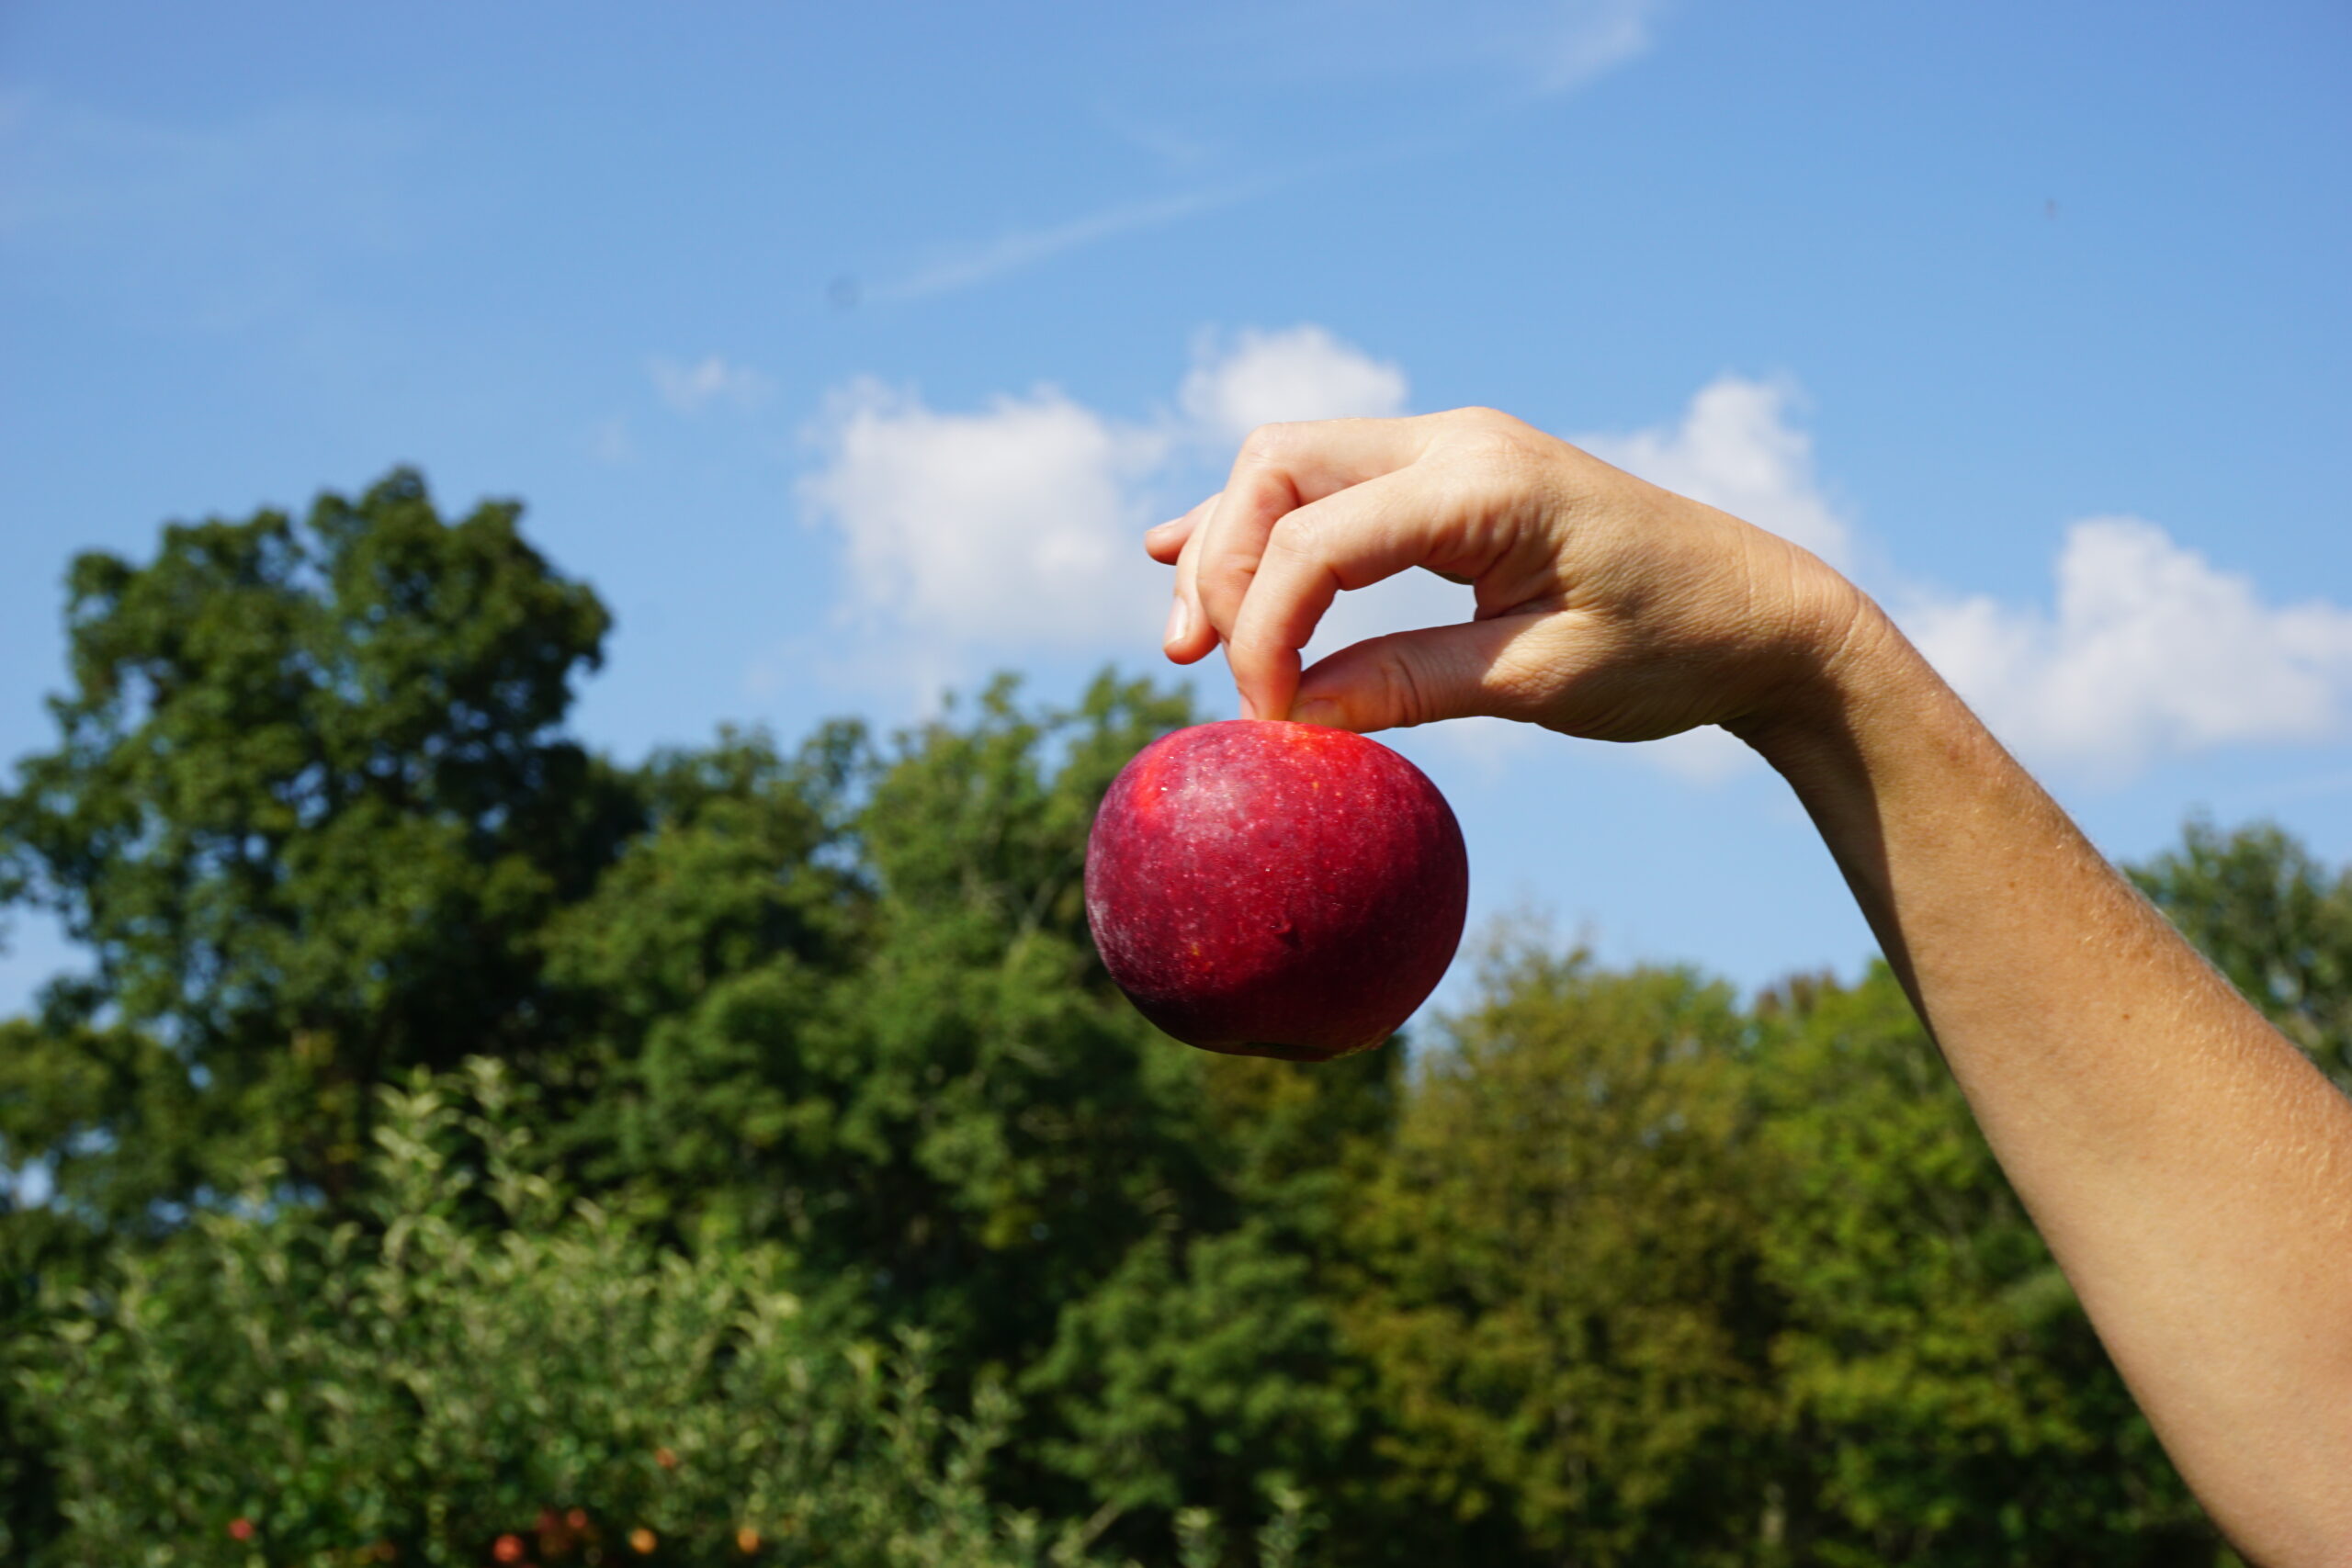
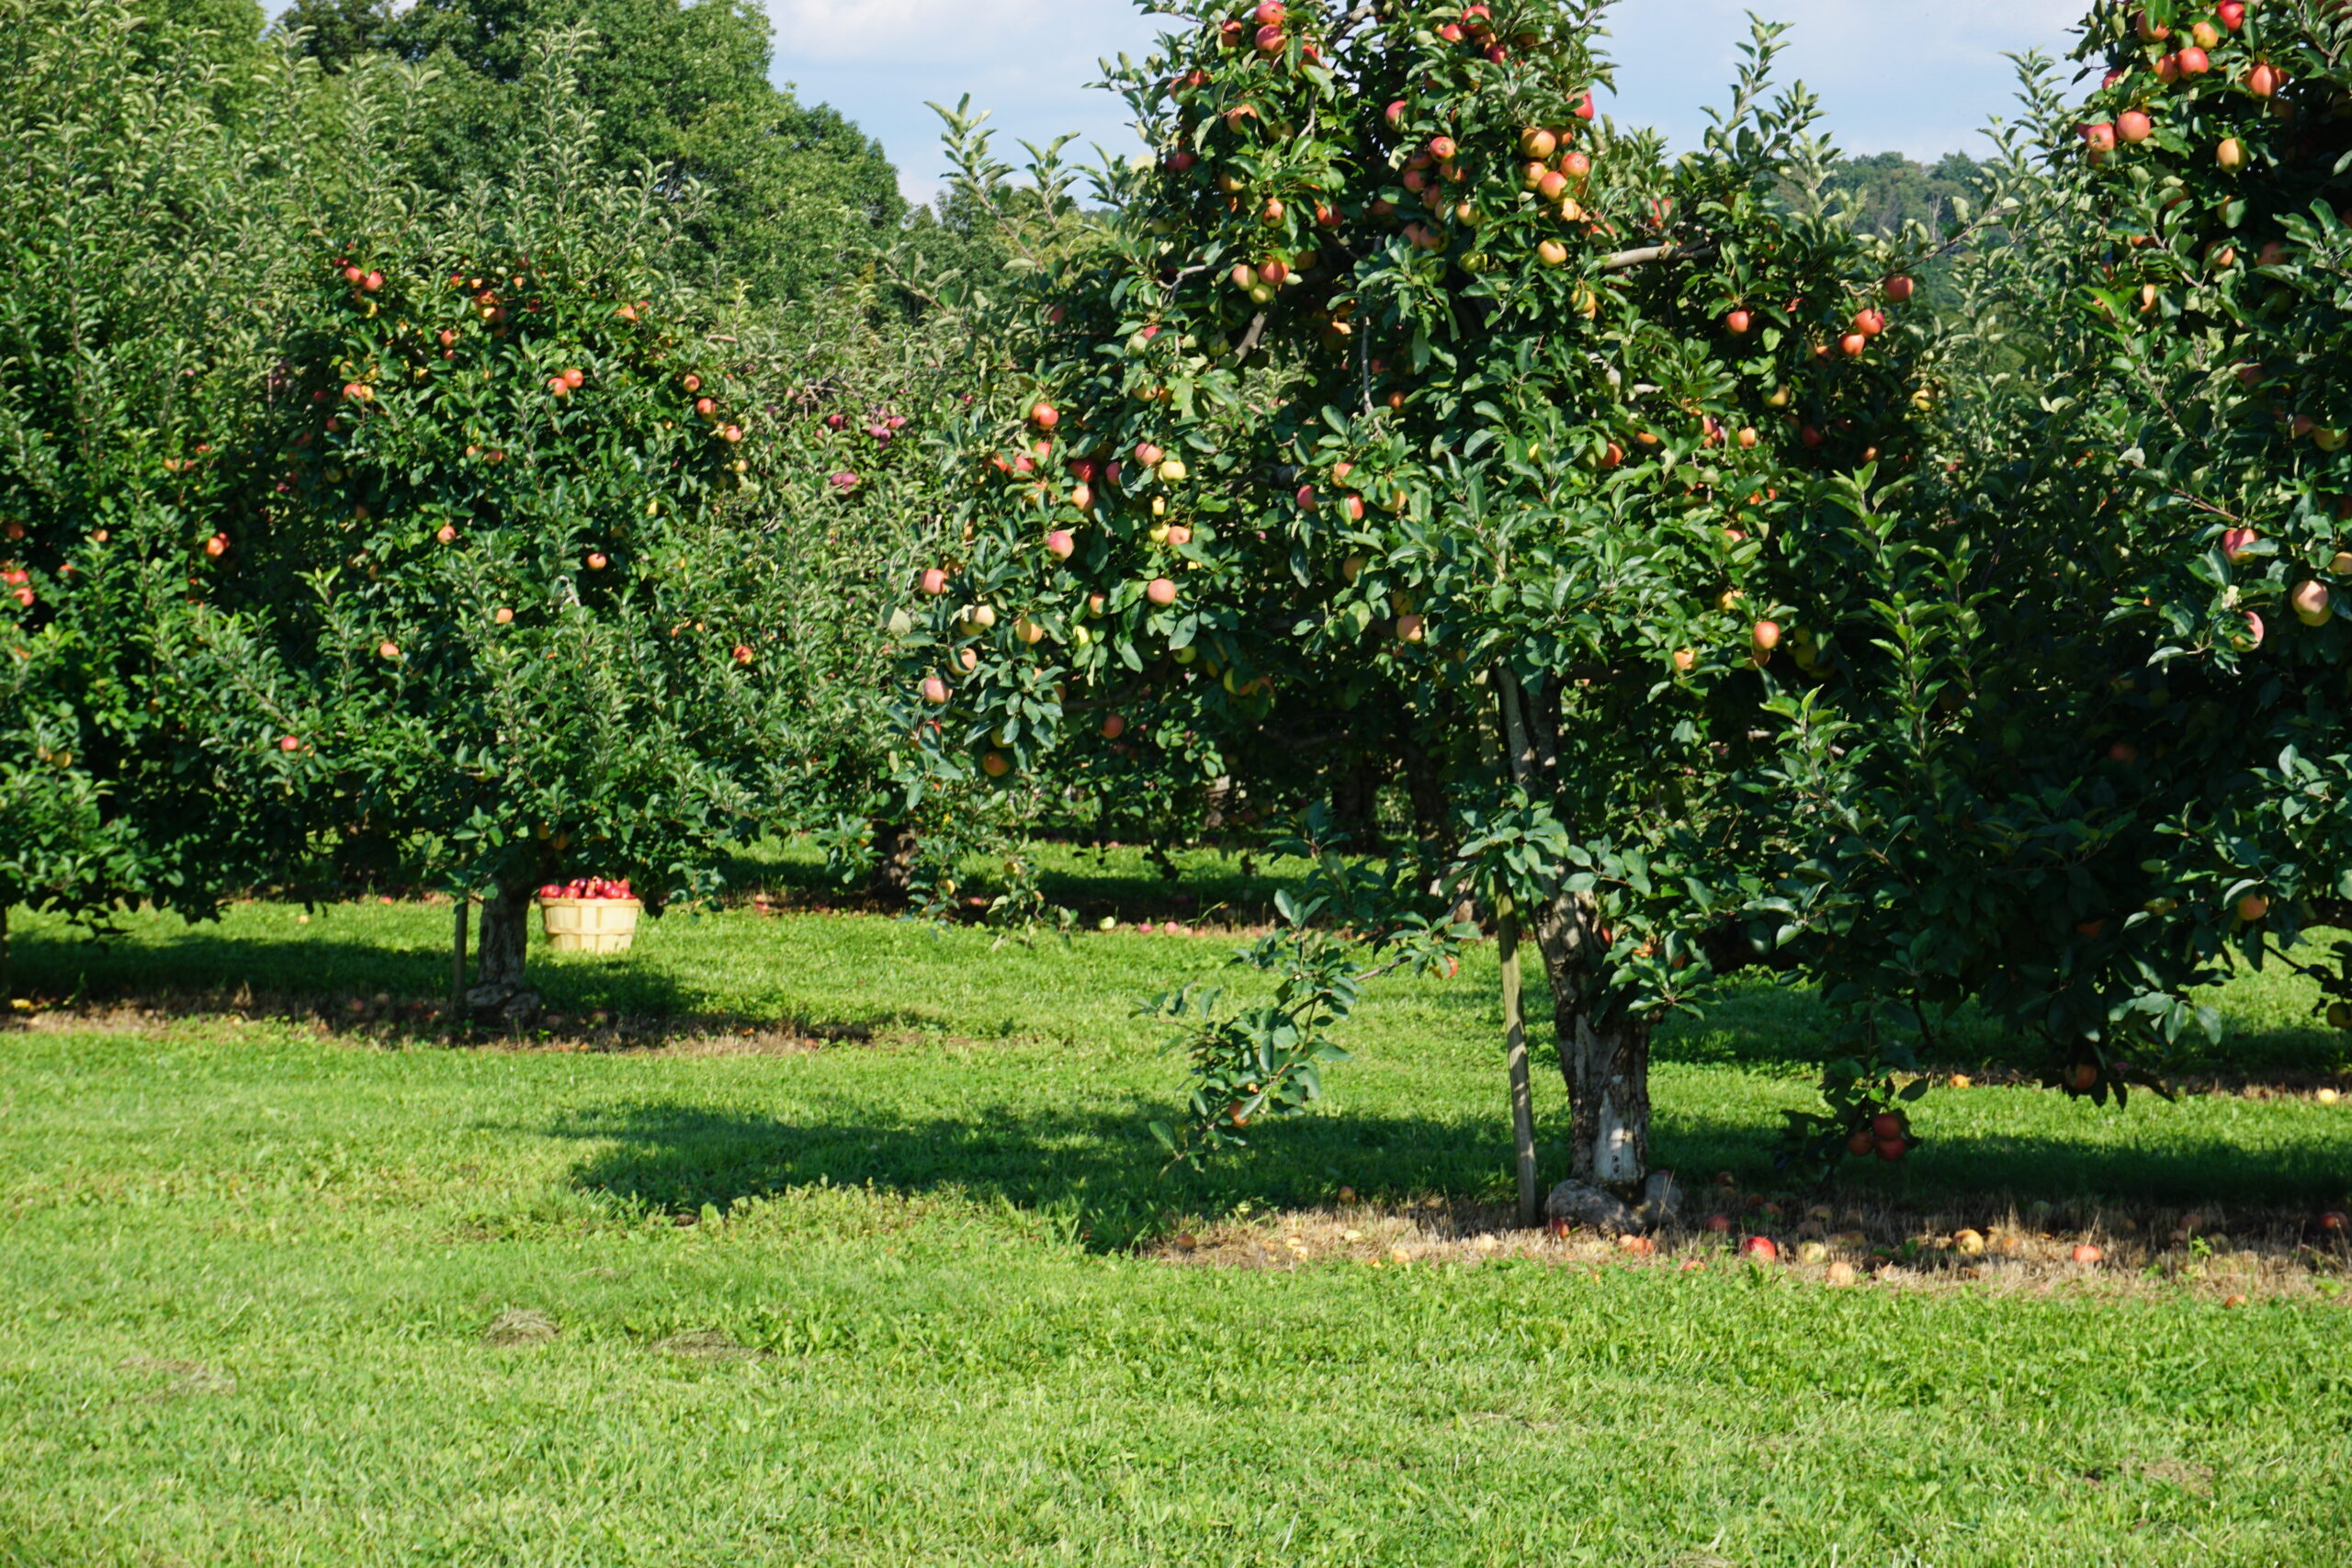
Specializing in a diverse selection of apples, including heirloom and cider varieties, as well as peaches, nectarines, and blueberries, we provide both U-pick opportunities and a convenient on-site store.
Anticipate an exciting array of apple varieties in fall of 2026, such as Sansa, Crimson Crisp, Winecrisp, Ashmead’s Kernel, Roxbury Russet, Arkansas Black, Baldwin, Northern Spy, Golden Russet, and St. Edmund’s Russet.
For enthusiasts of hard cider, we’re introducing Bulmers Norman, Harry Masters Jersey, Brown’s Apple, Redfield, Northern Spy, and Golden Russet apples.
Our current offerings include beloved varieties like Honey Crisp, Gala, Cortland, Macoun, Mutsu, McIntosh, Gavenstein, Sunrise, Fortune, Golden Delicious, Red Delicious, Creston, Stellar, Empire, and Shizuka.
Our Services
What We Offer
Orchard
- PYO Peaches (August)
- PYO Blueberries (starting in July)
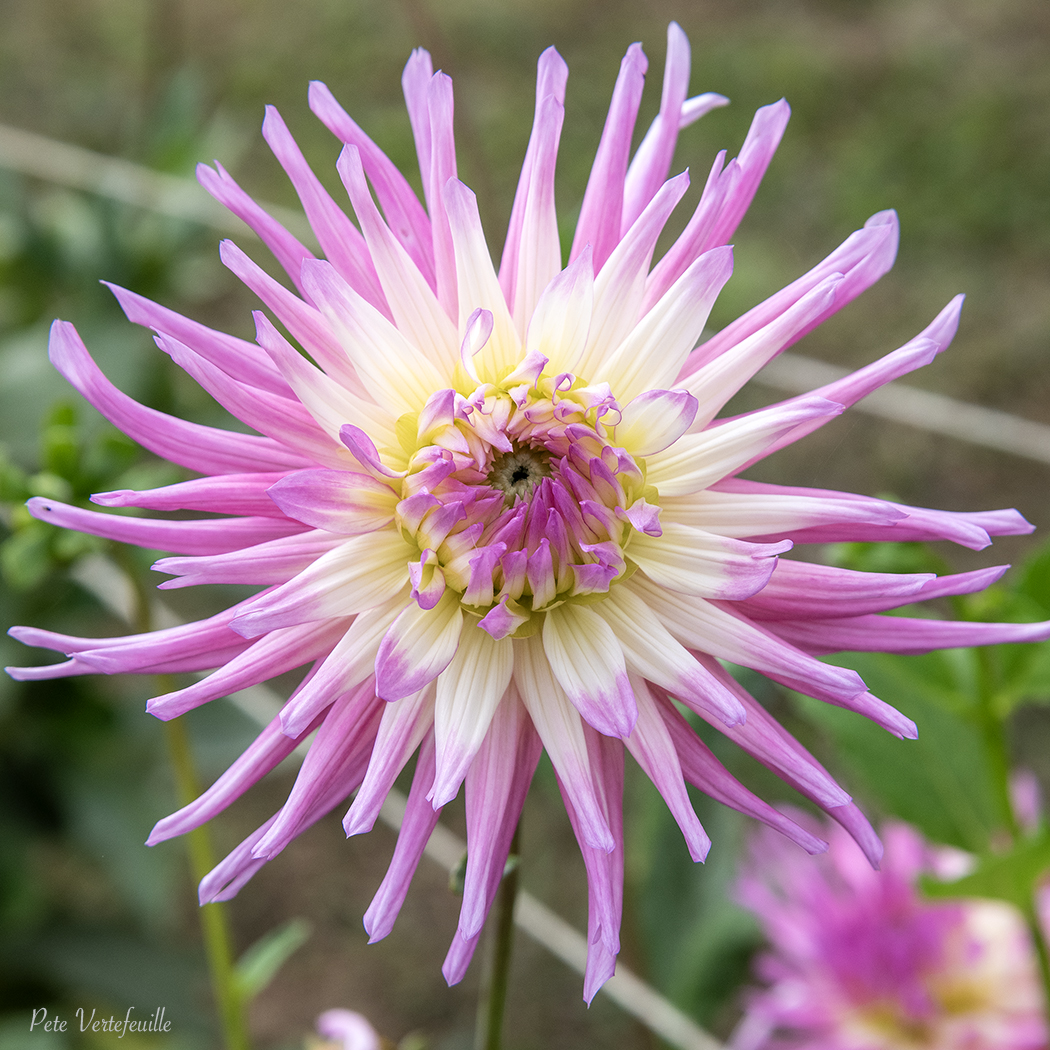
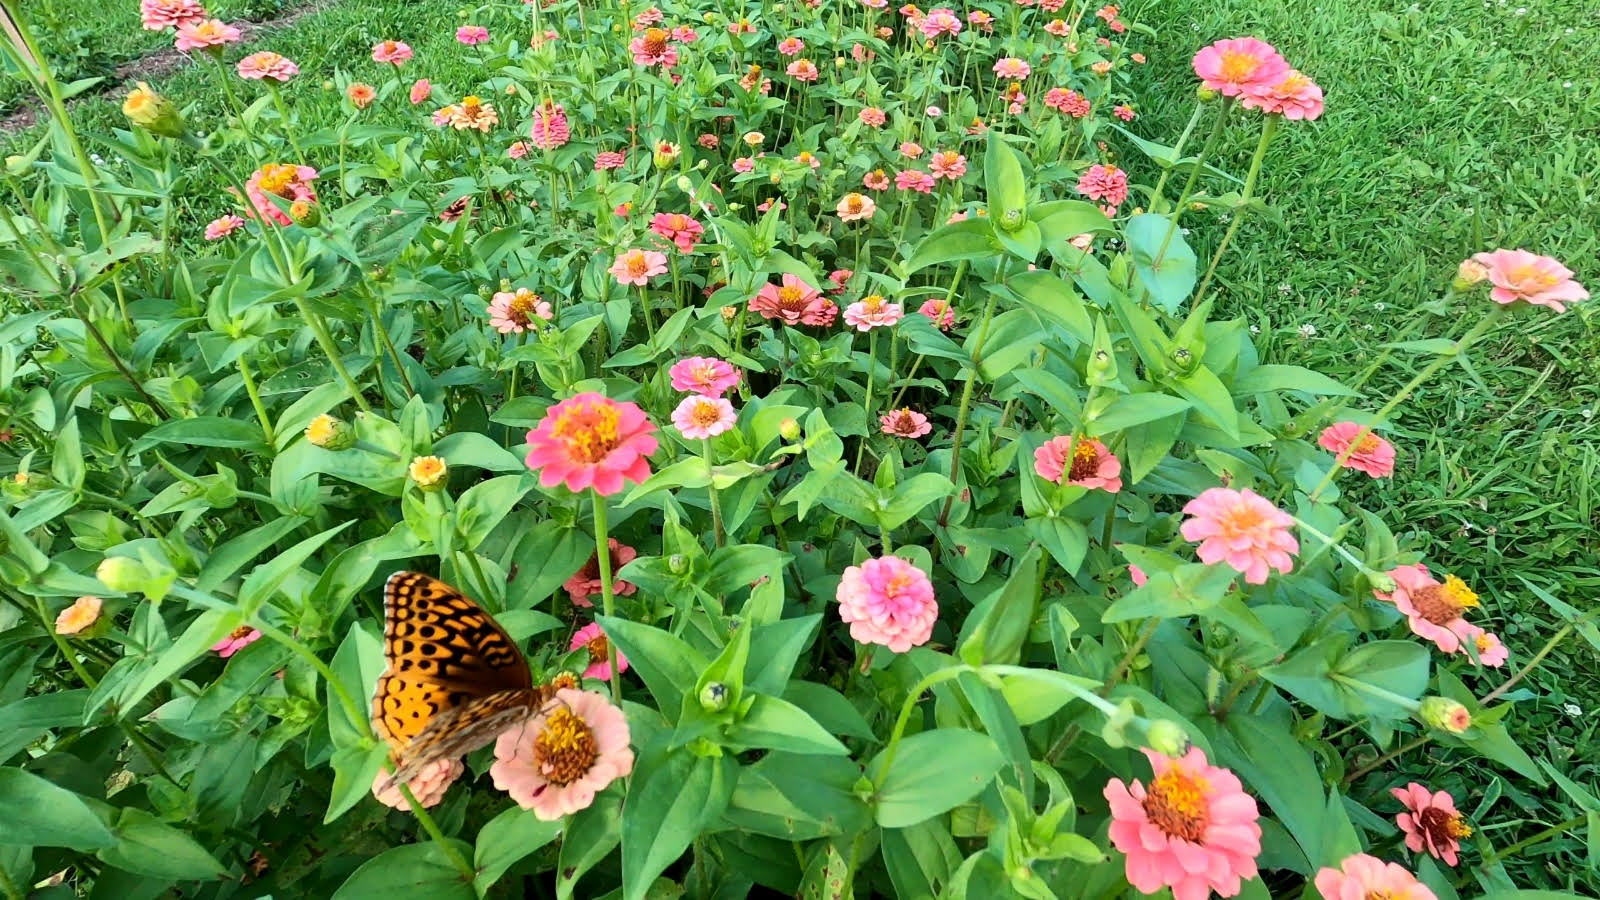
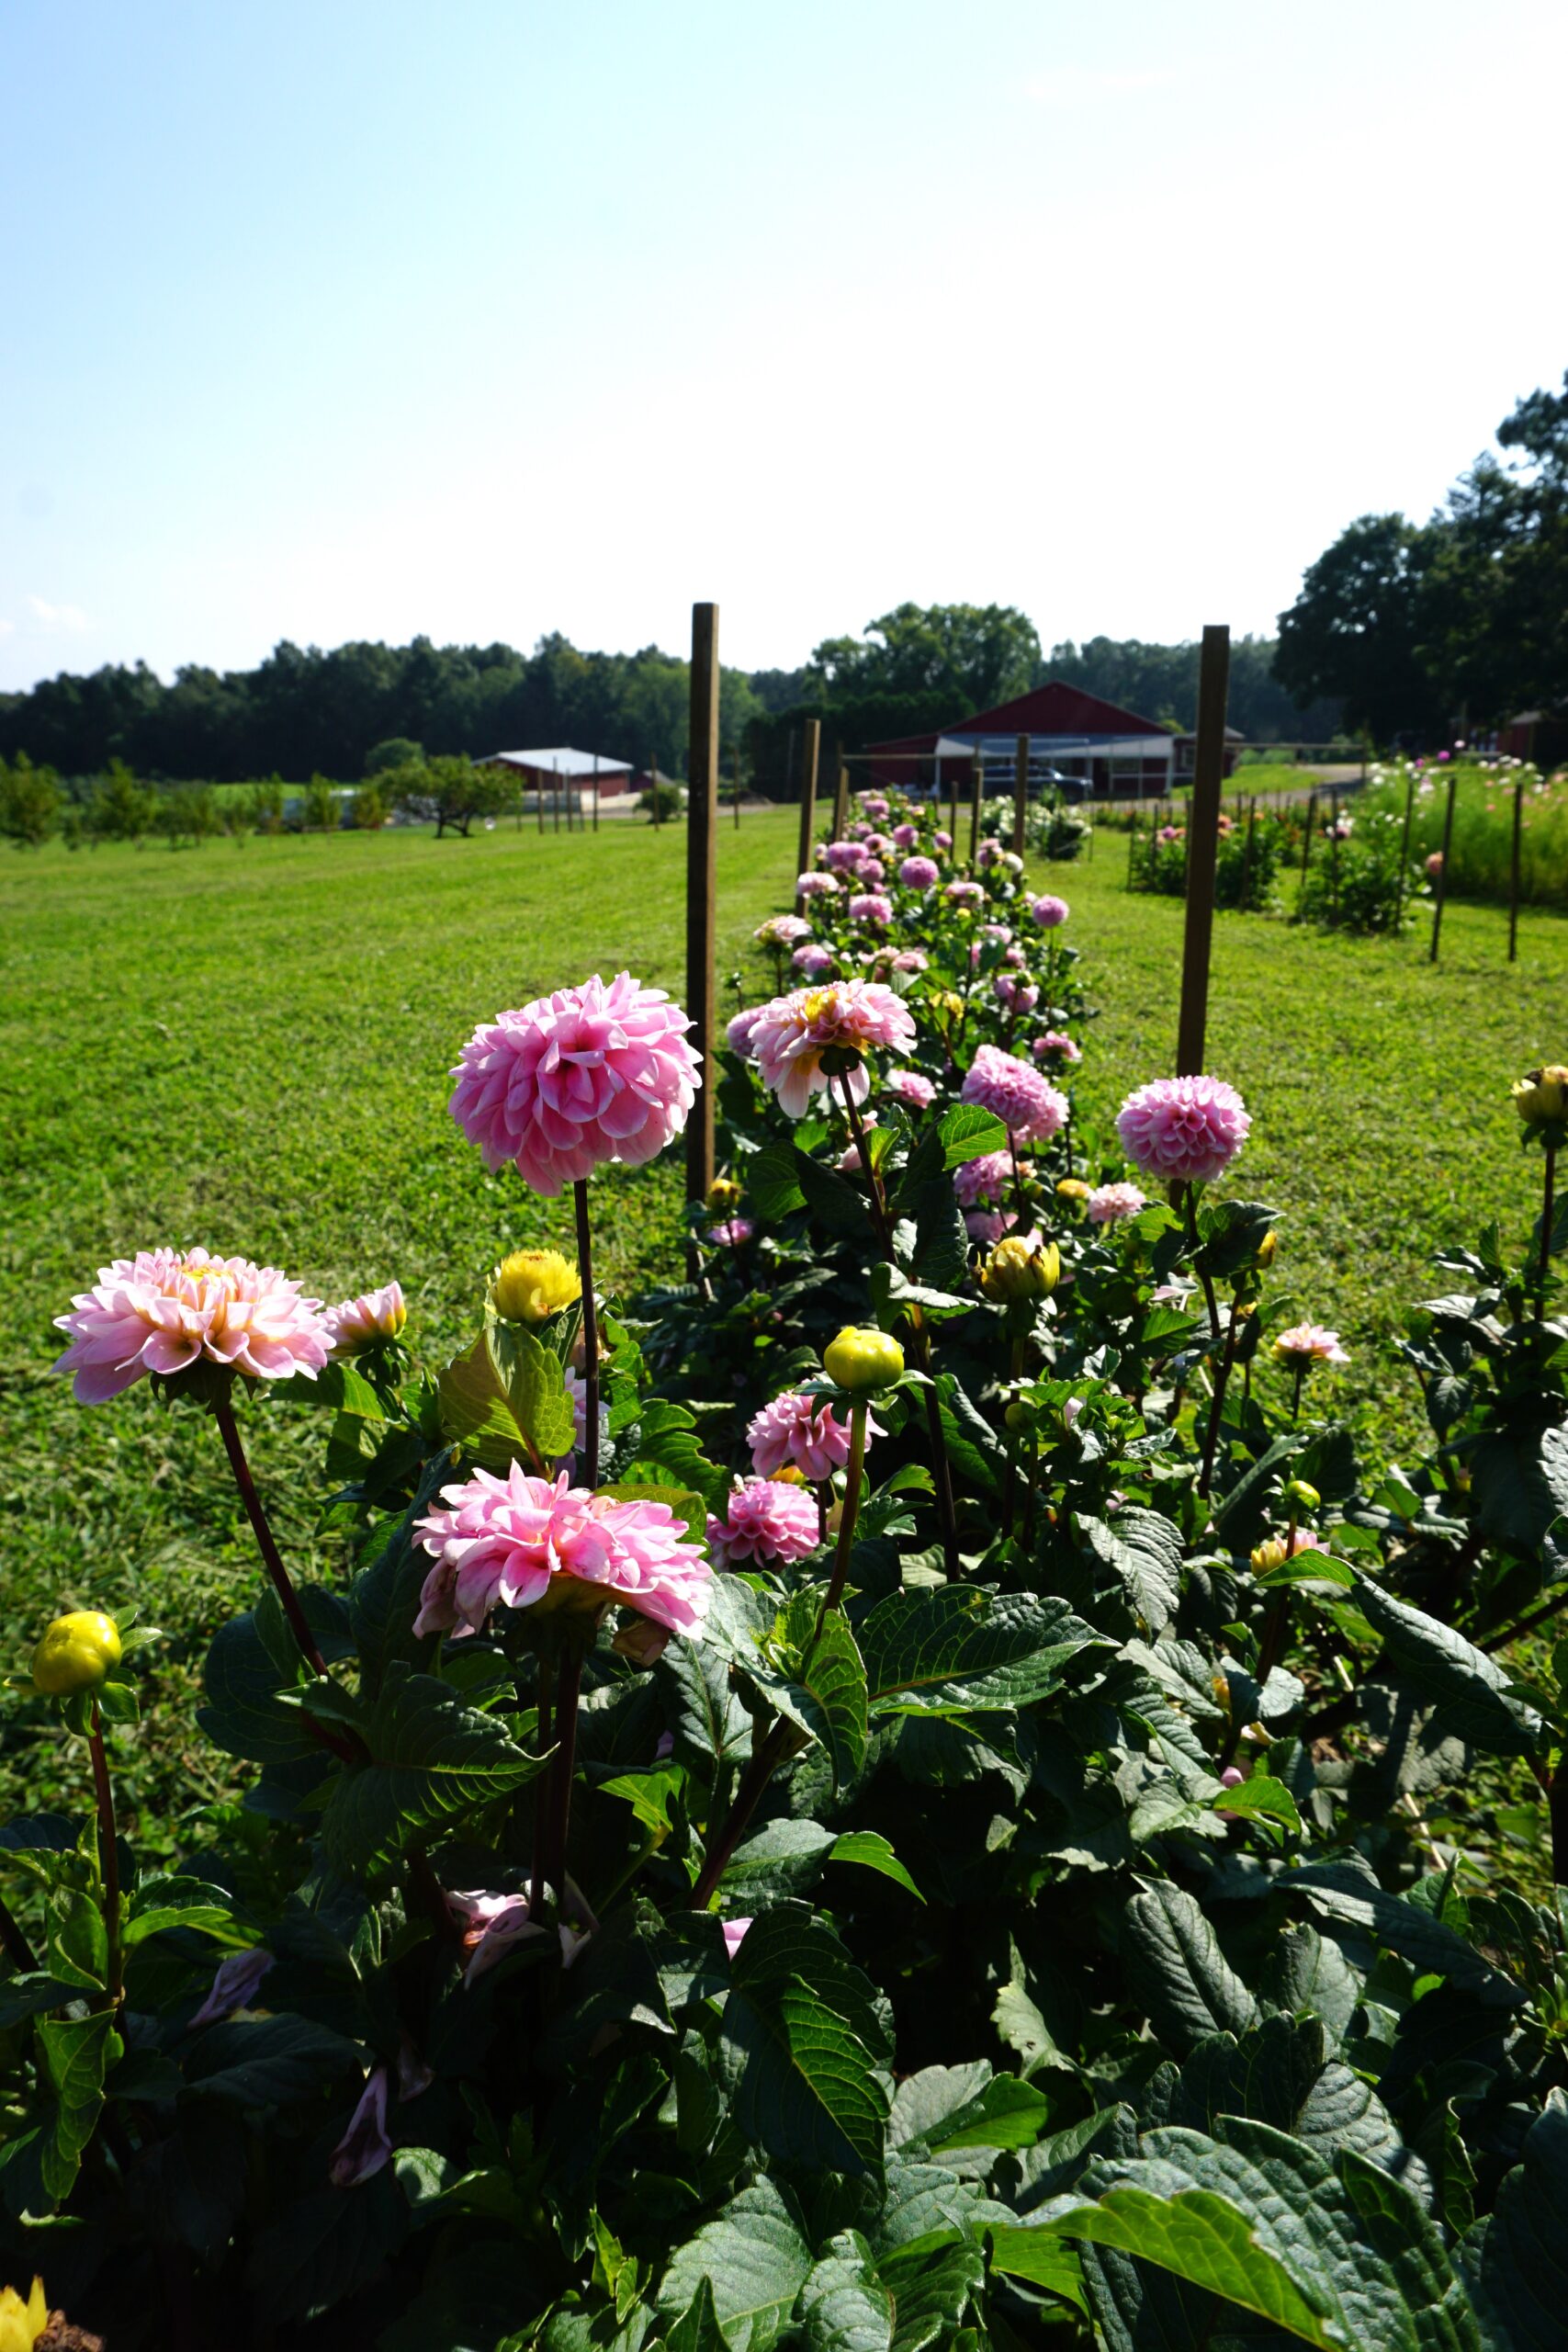
- PYO Flowers (starting in Aug)
- PYO Apples (starting in Sept)
- Pumpkins, mums and cornstalks for fall decorating
Store
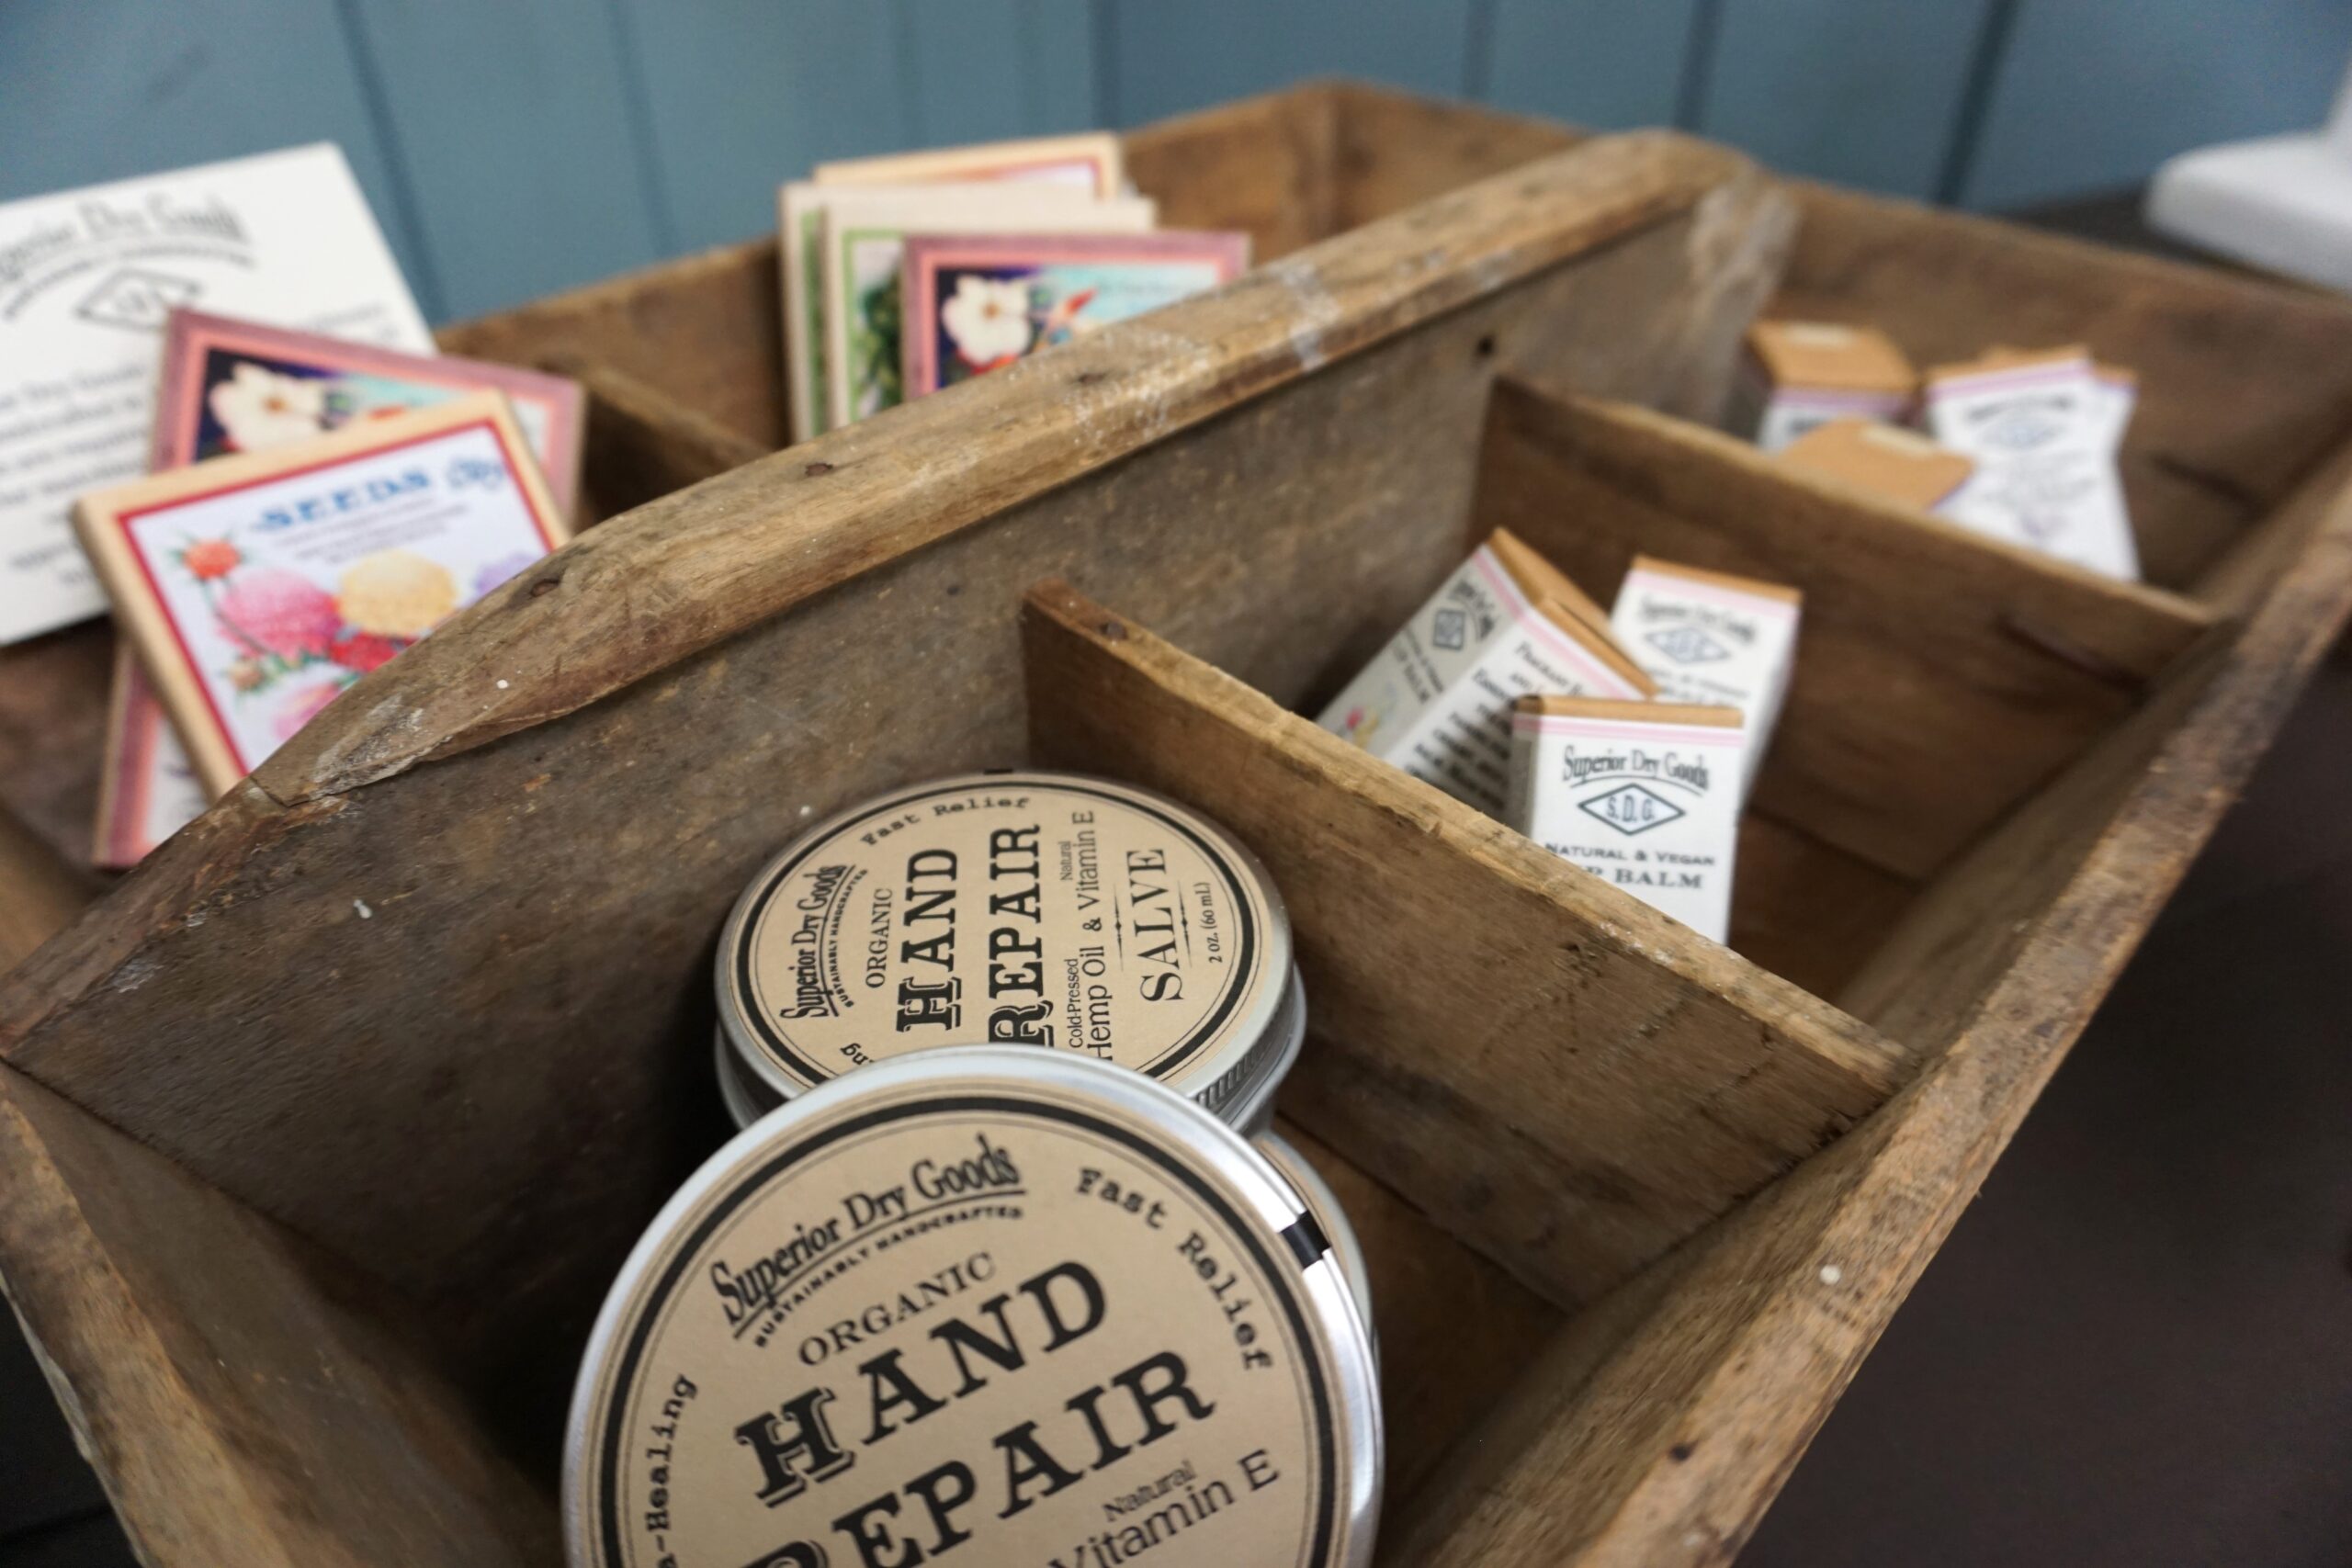
The store carries seasonal produce along with freshly baked breads, dairy products and eggs, cider, honeys, maple syrups and jams. Also carrying a selection of handcrafted heirloom quality items from local artists and craftsmen to make everyday life more beautiful.
- Freshly picked apples by the bag and “PYO” in the store by the pound.
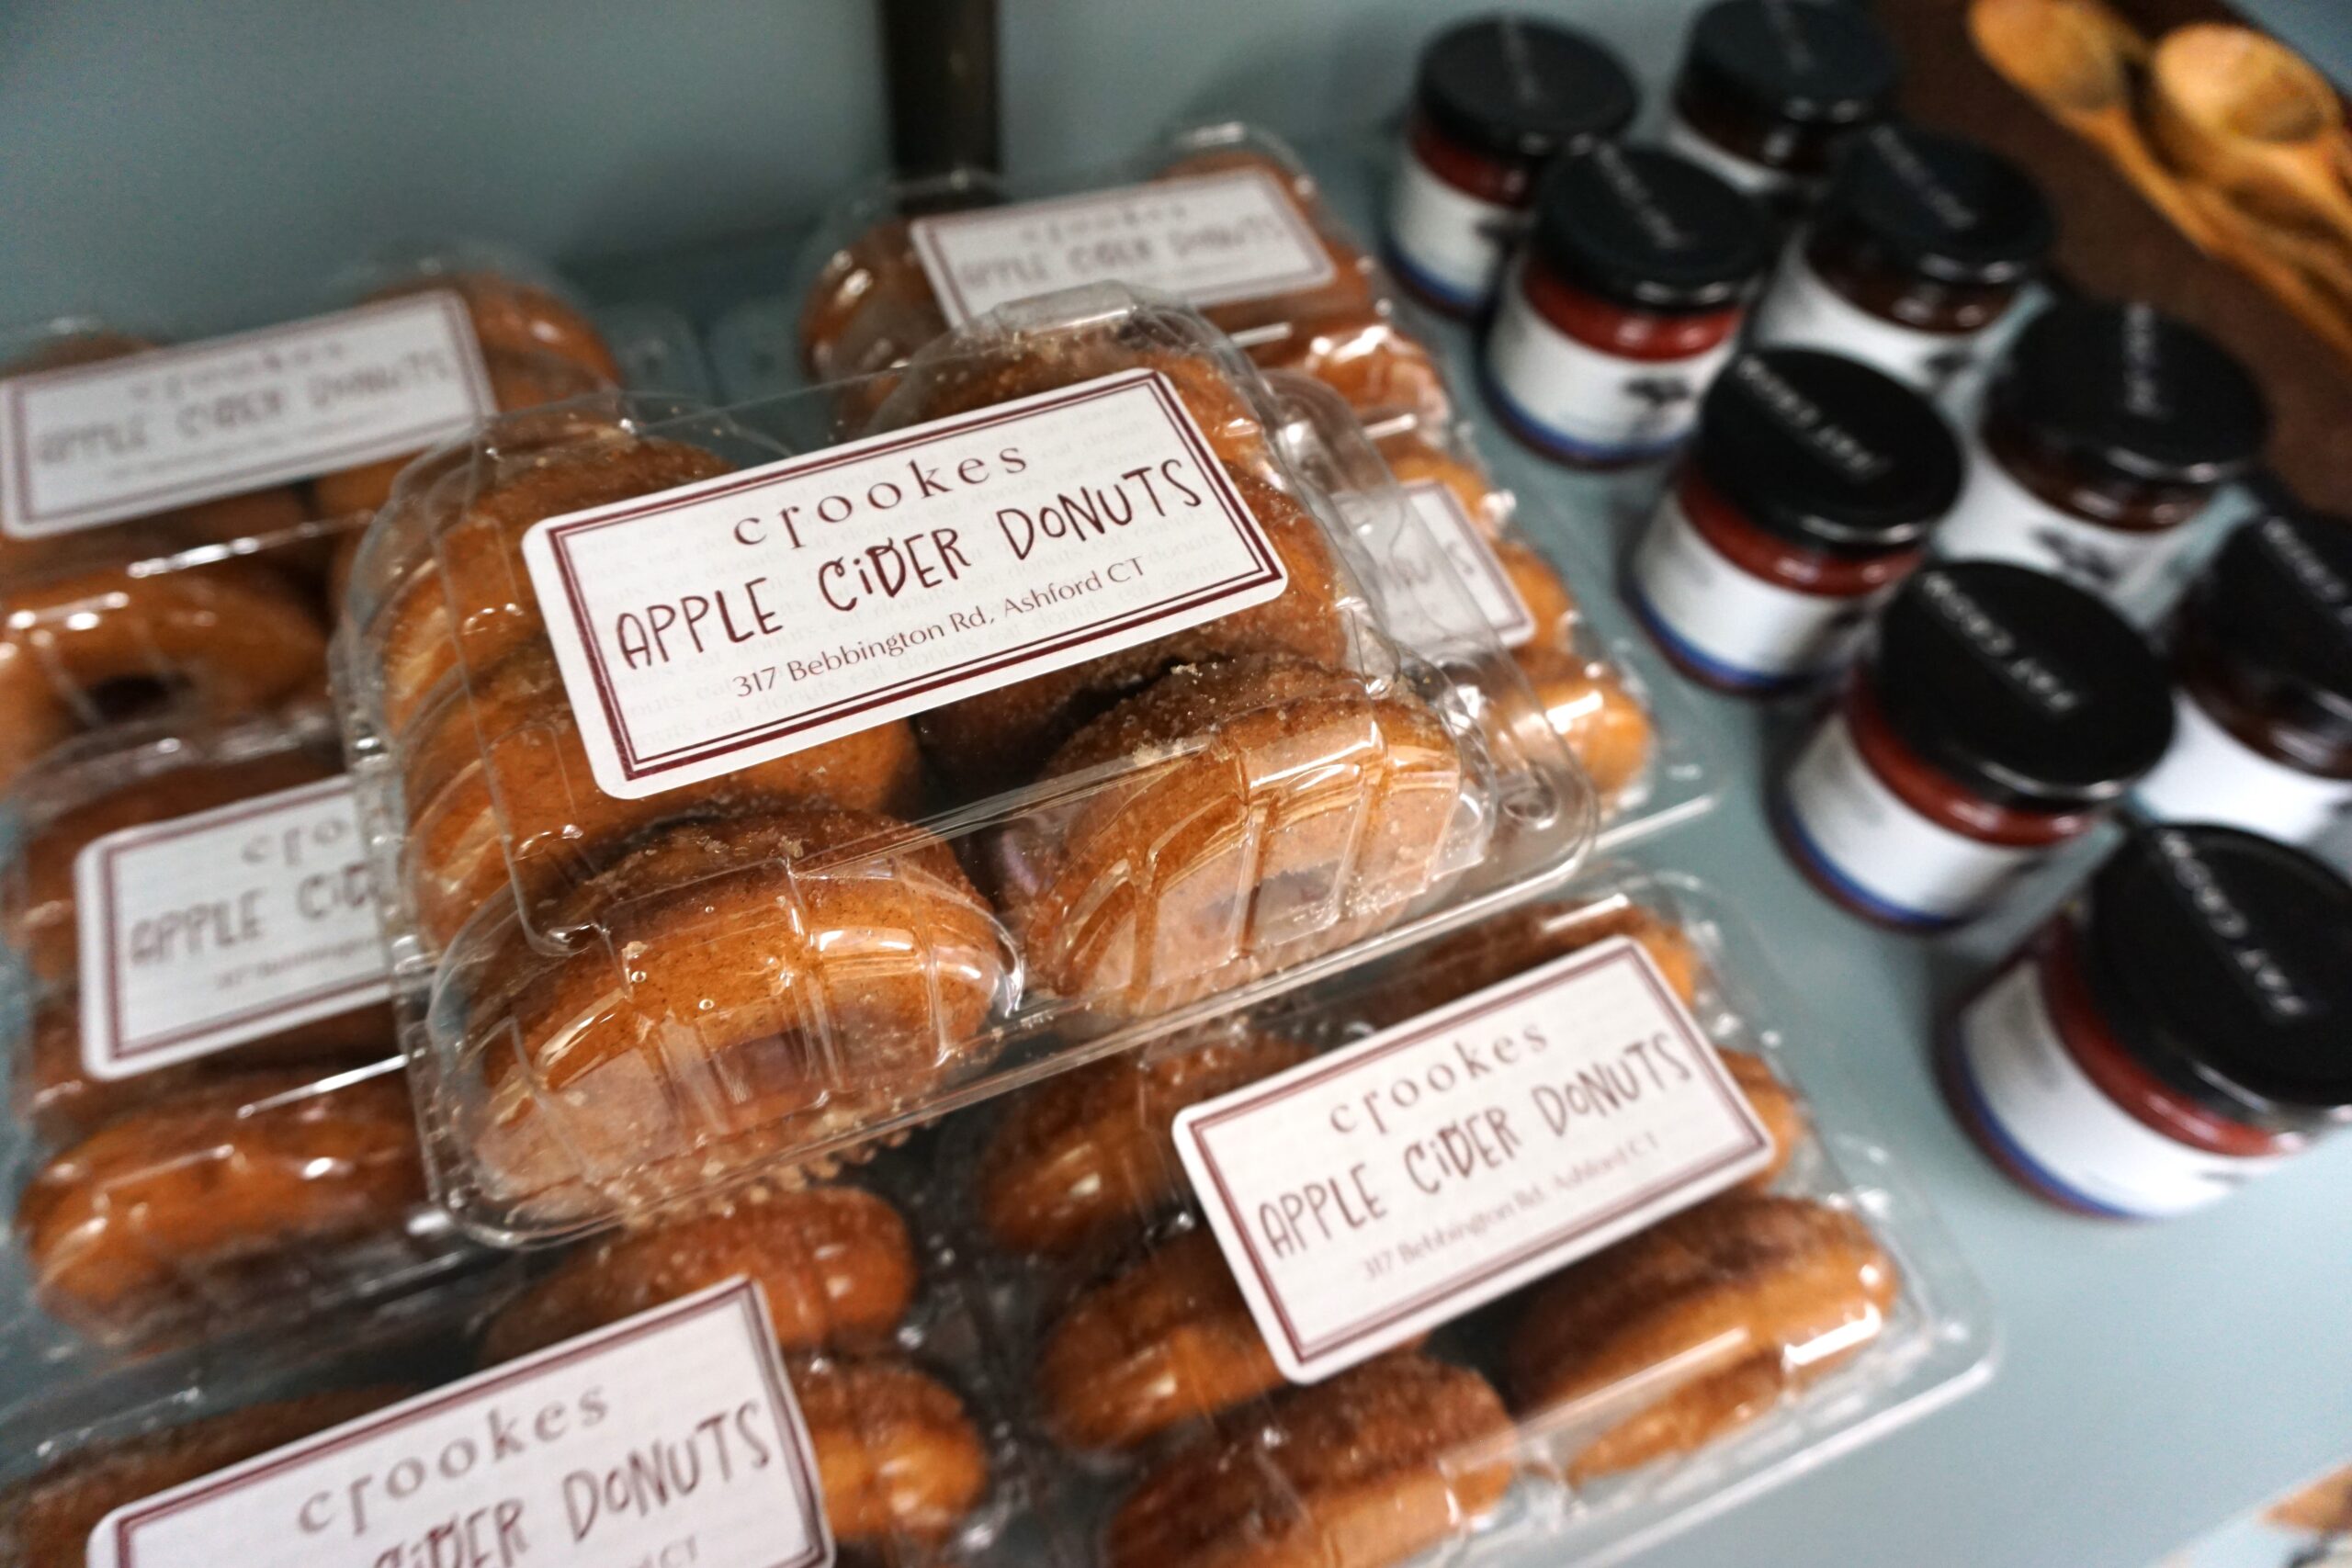
- Apple Cider
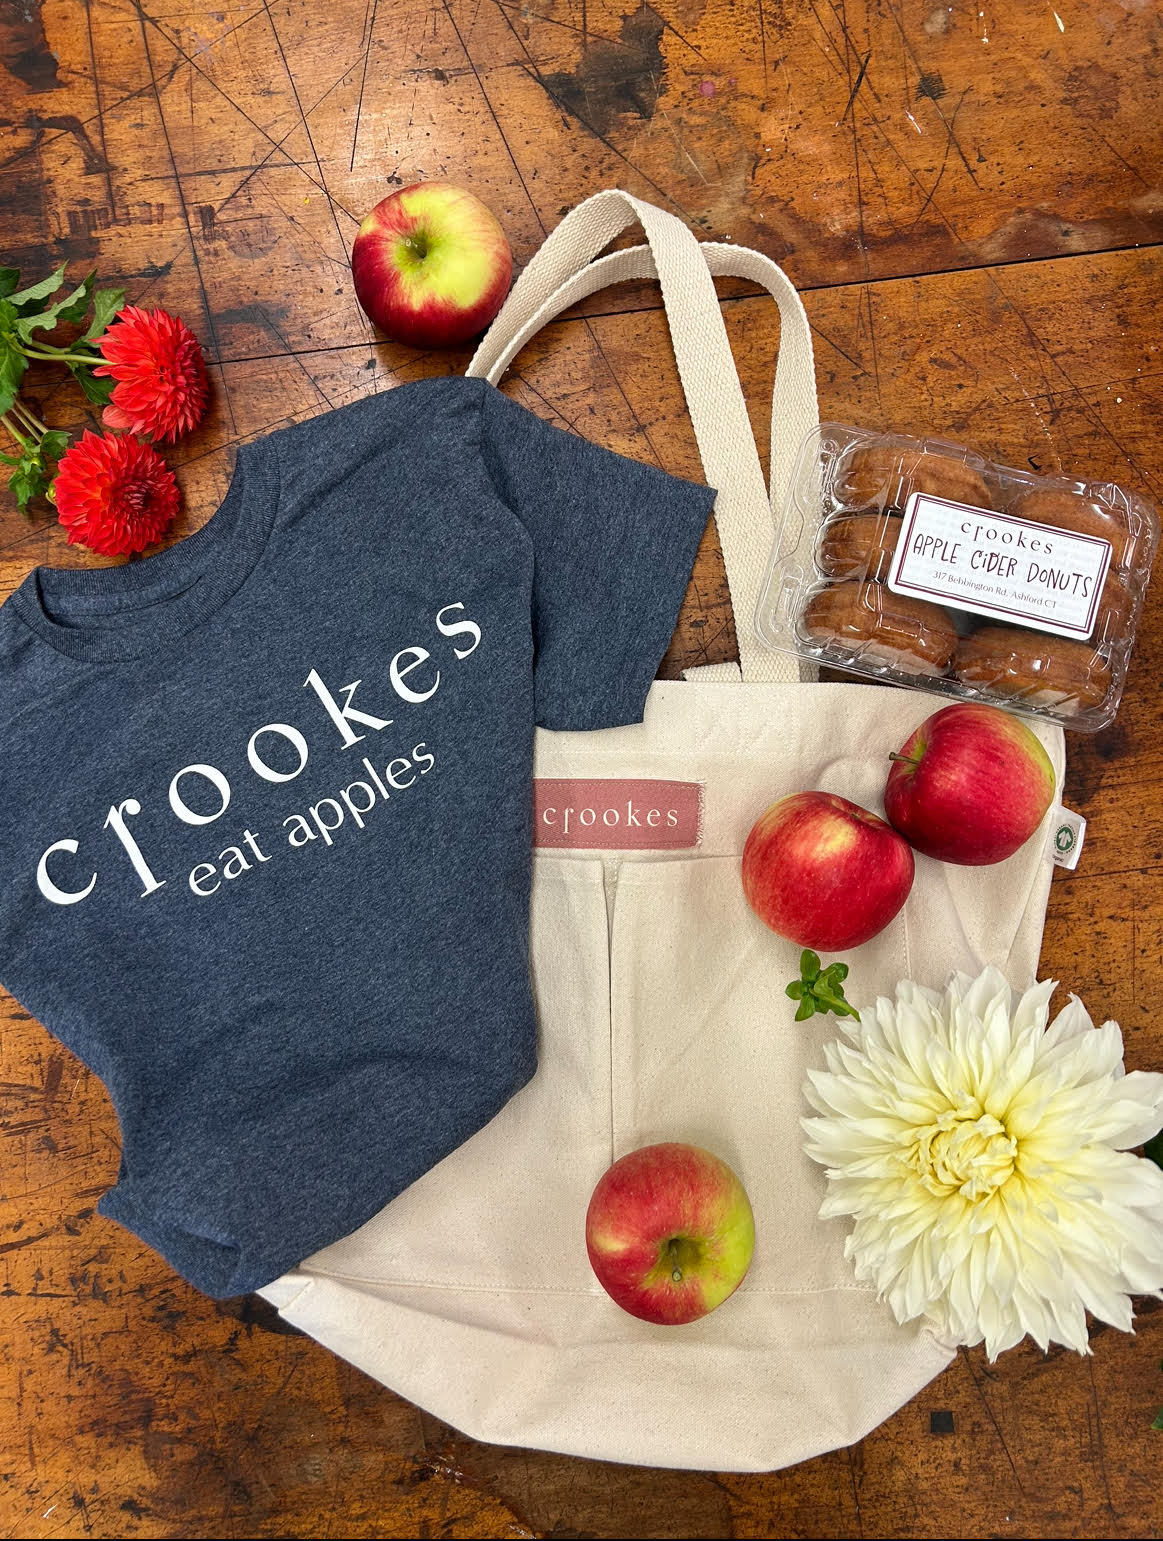
- Apple Cider Donuts
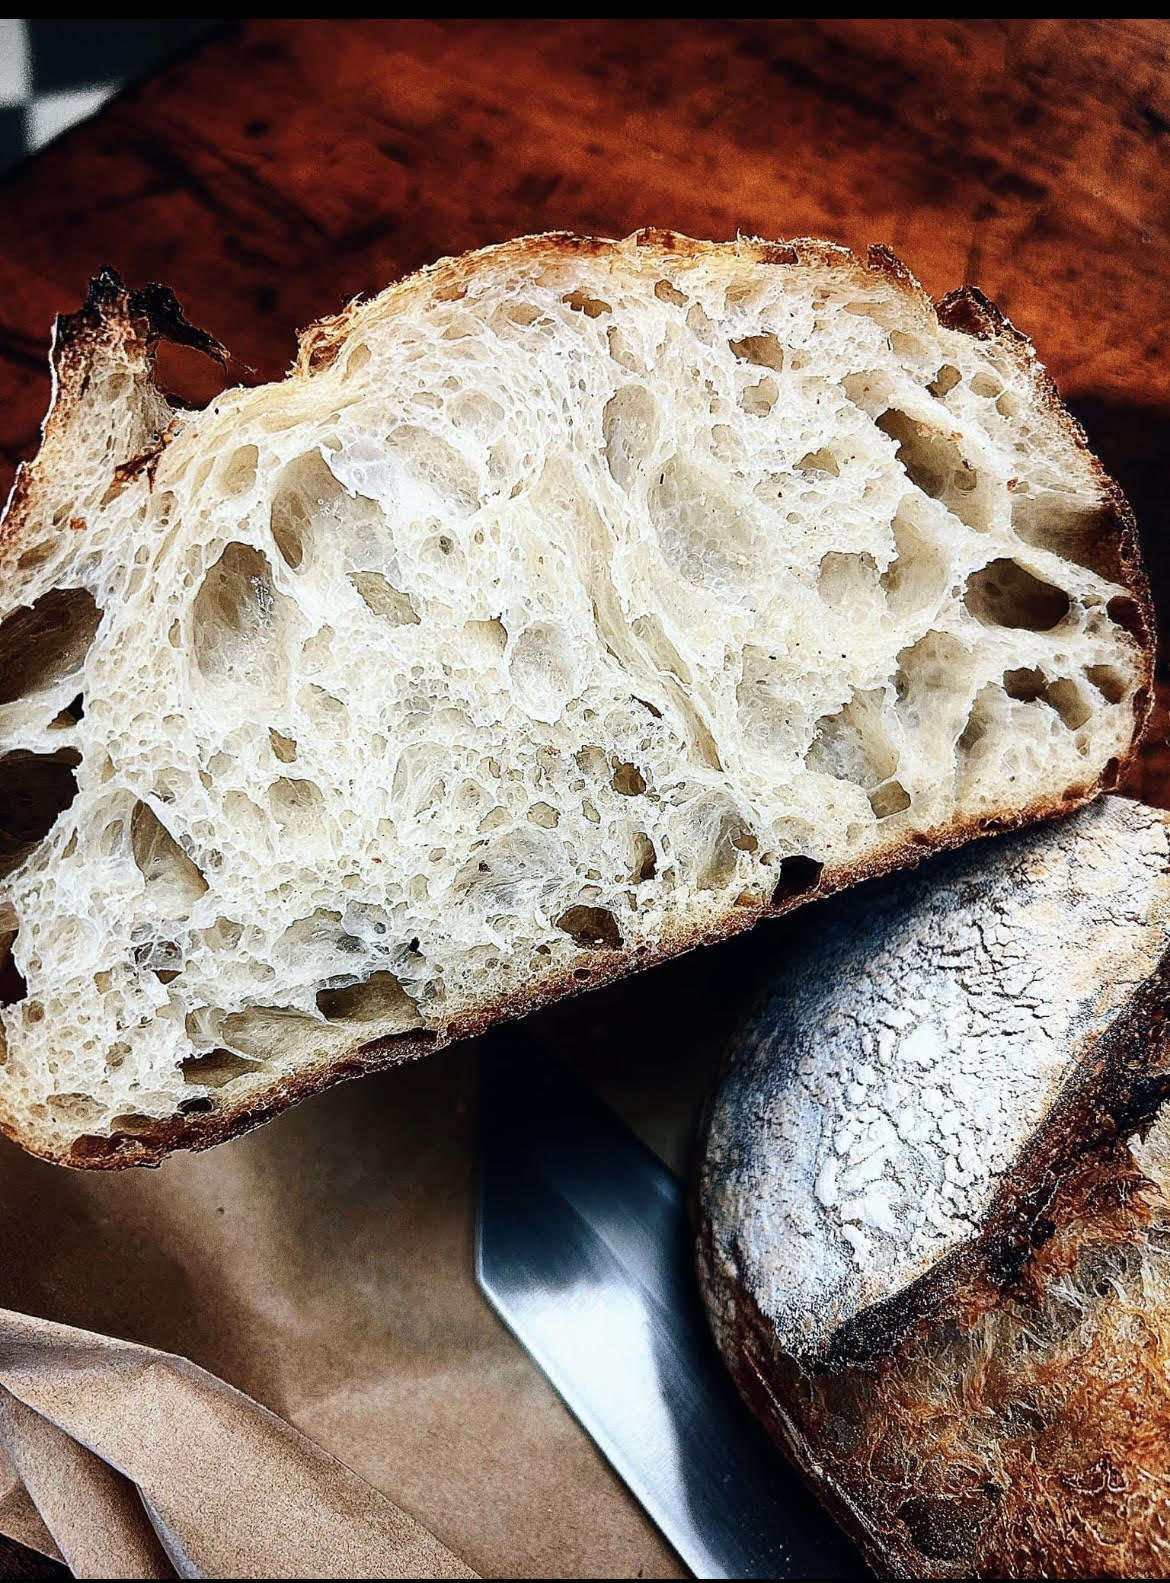
- Fresh Sourdough breads
- Coming soon: Apple Crisp and other baked goods
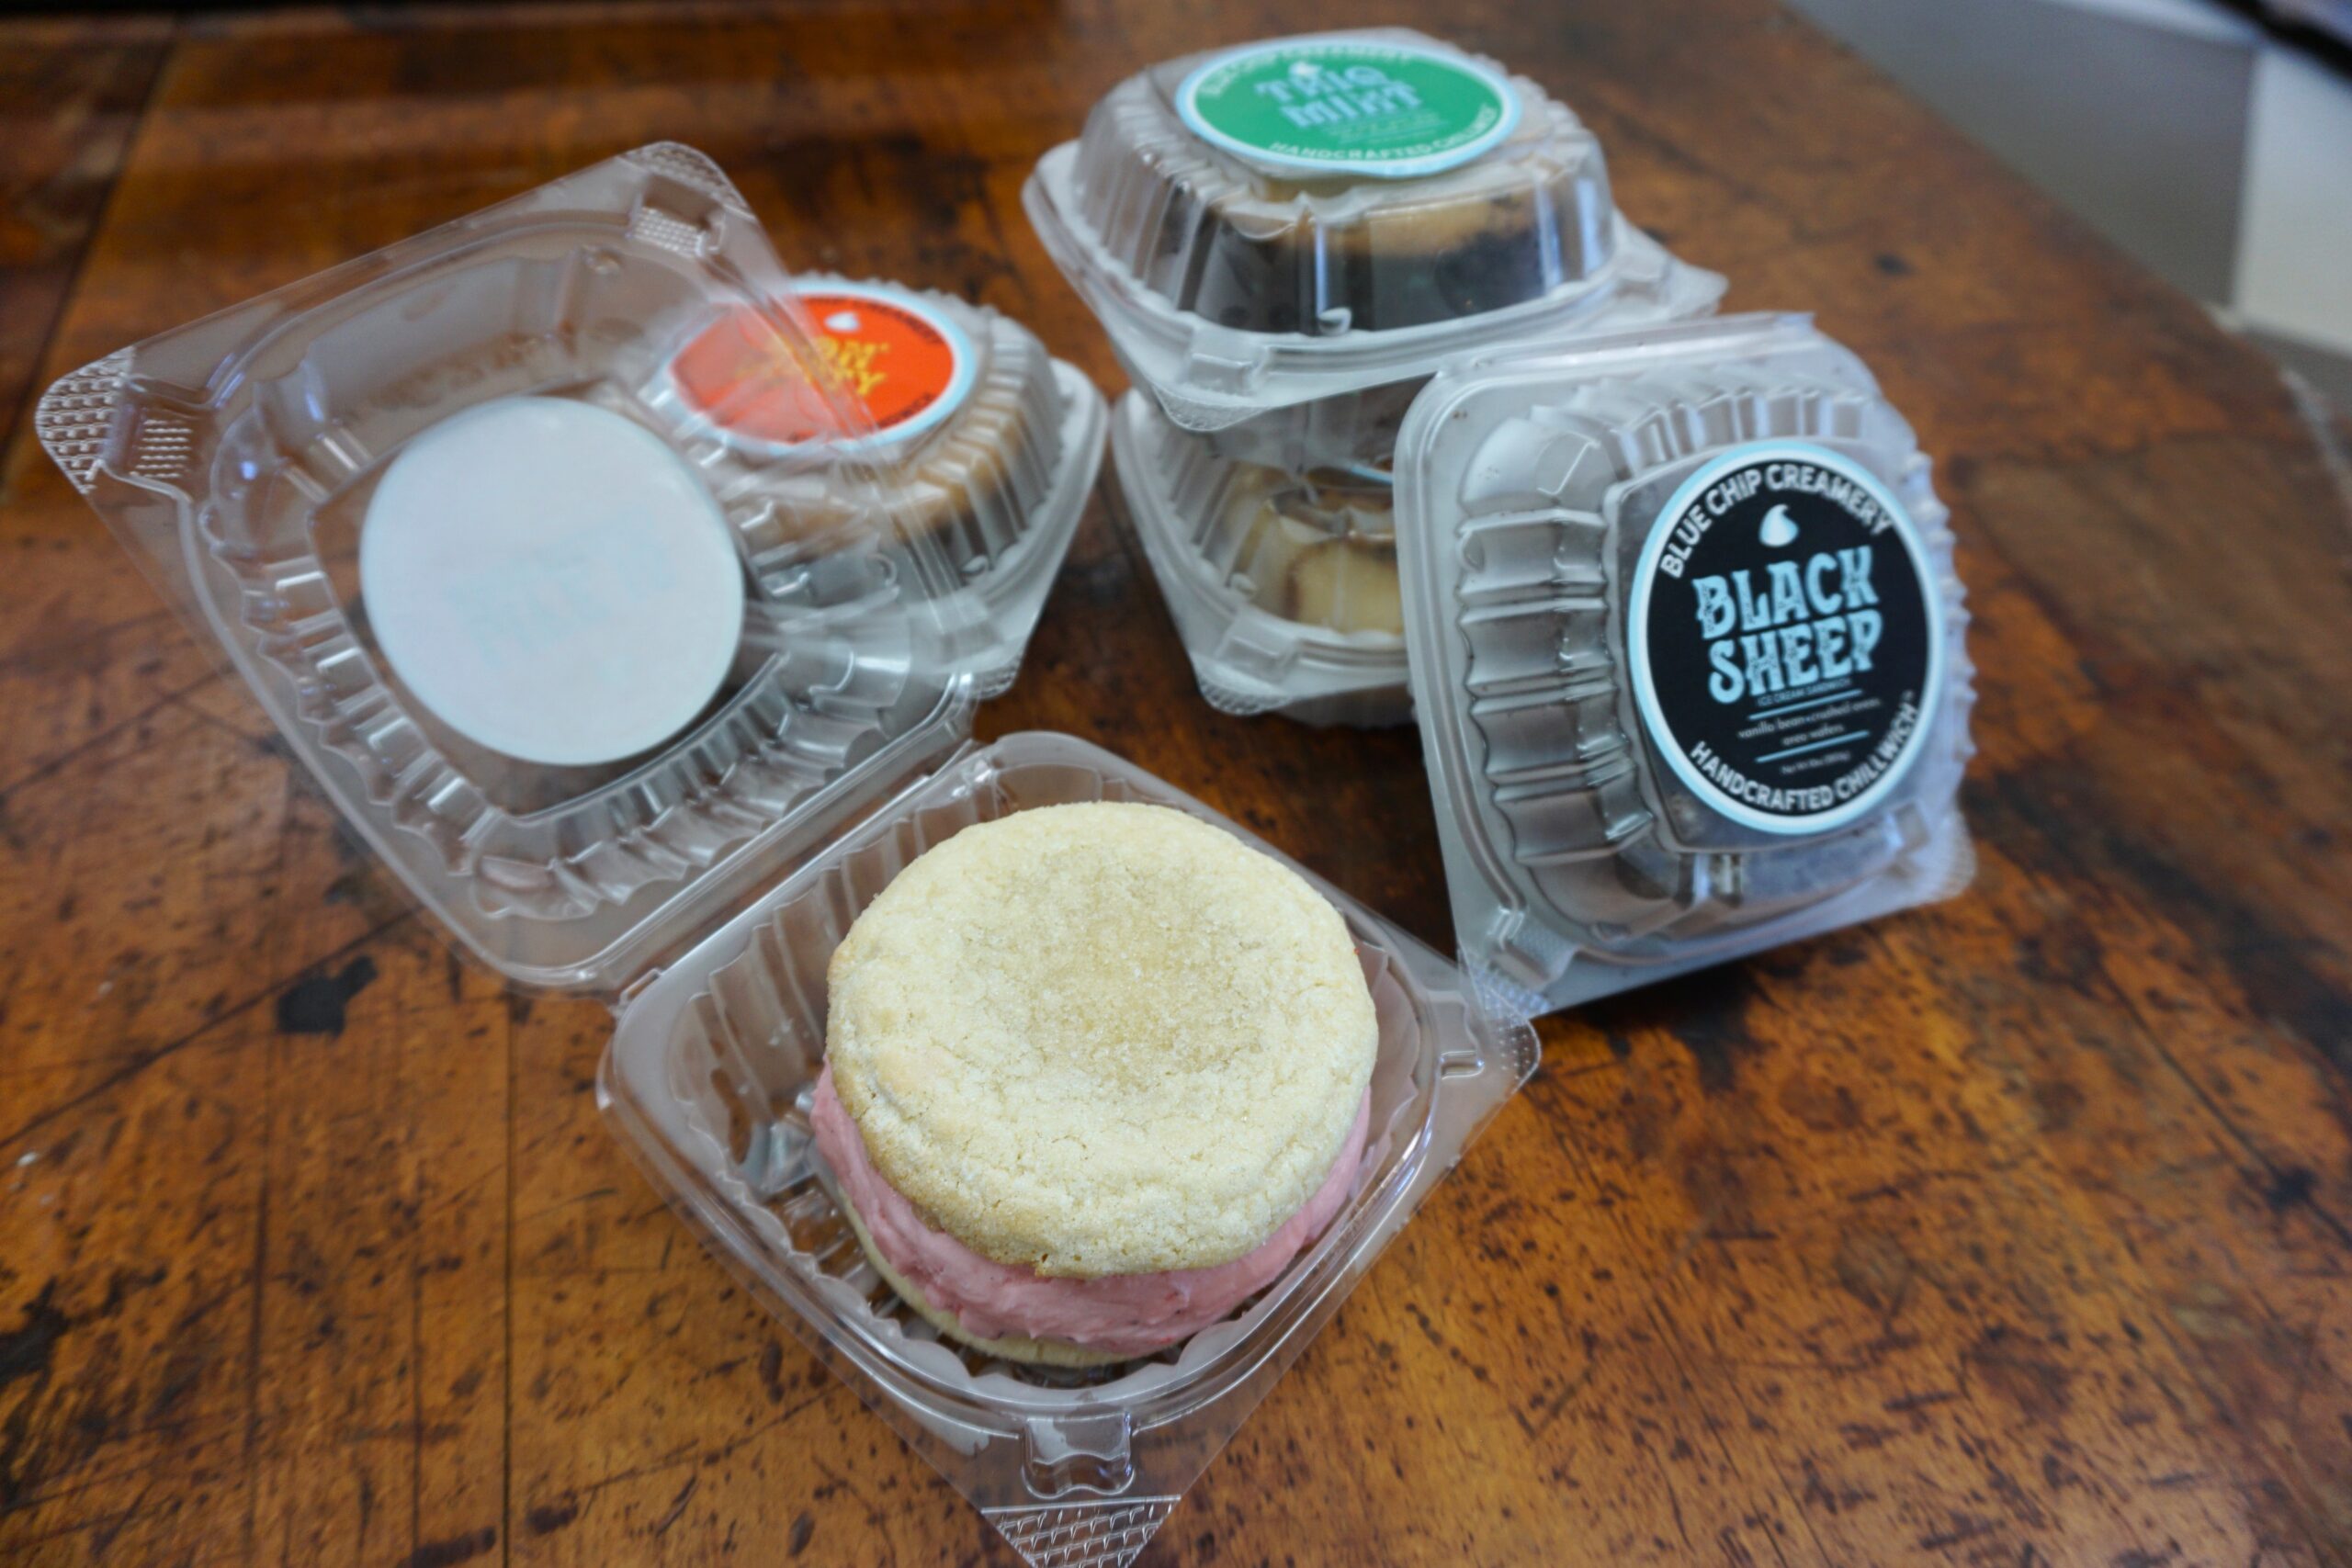
- Icecream sandwiches by Blue Chip Creamery of Wethersfield CT
- Variety of jams & honeys
- maple syrup
- local grass fed beef
- dried meats
- local cheese
- kombucha & teas
- handmade soaps
- sustainably made household products
- handmade wood trays, and kitchen utensils
- Handmade Pottery
- Crookes Merch: T-shirts and tote bags